Genome Browsers
The genome browsers like UCSC Genome Browser and Ensembl allow to read and display a number of features, such as genomic intervals in different formats.
For example, you can load BED and GTF files and display them in the genomic context. So you can know where a ChIP-seq peaks are located in the genome.
Let’s first convert our 9-field bed file in a more standard 6-field one:
cut -f 1-6 H3K4me_peaks.narrowPeak > H3K4me_peaks.bed
The program cut allows to extract columns using a list or intervals.
NOTE: However, you cannot change the order, e.g., cut -f 3,2 (correct: cut -f 2,3), or to use the same column more than once.
Try these options!
Uploading to UCSC genome browser
We can visualize the human genome at the UCSC Genome Browser (of the same hg38 assembly we used throught the above analysis) using this link.
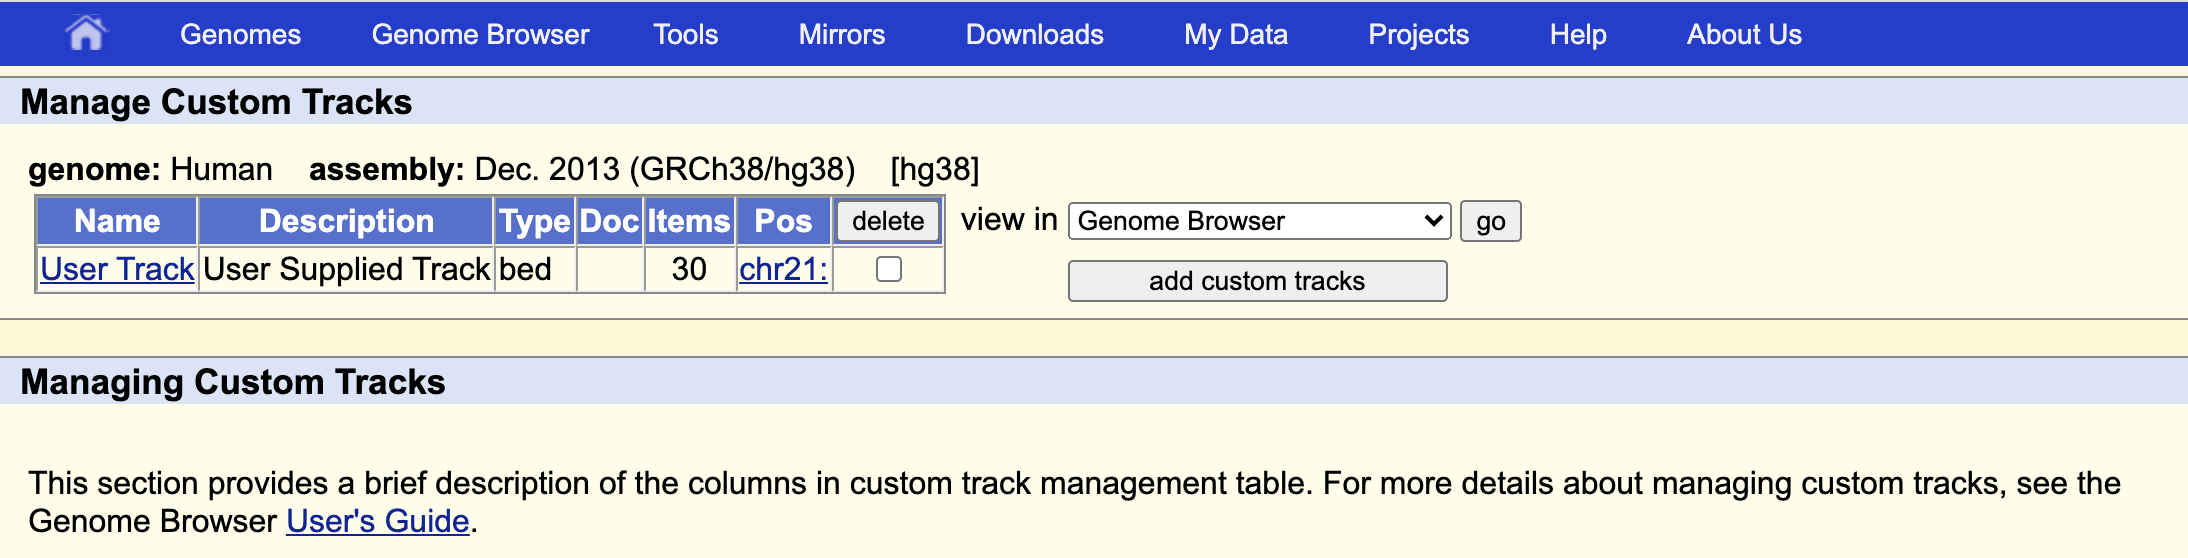
We can upload our bed file by clicking on add custom tracks button, just below the picture.
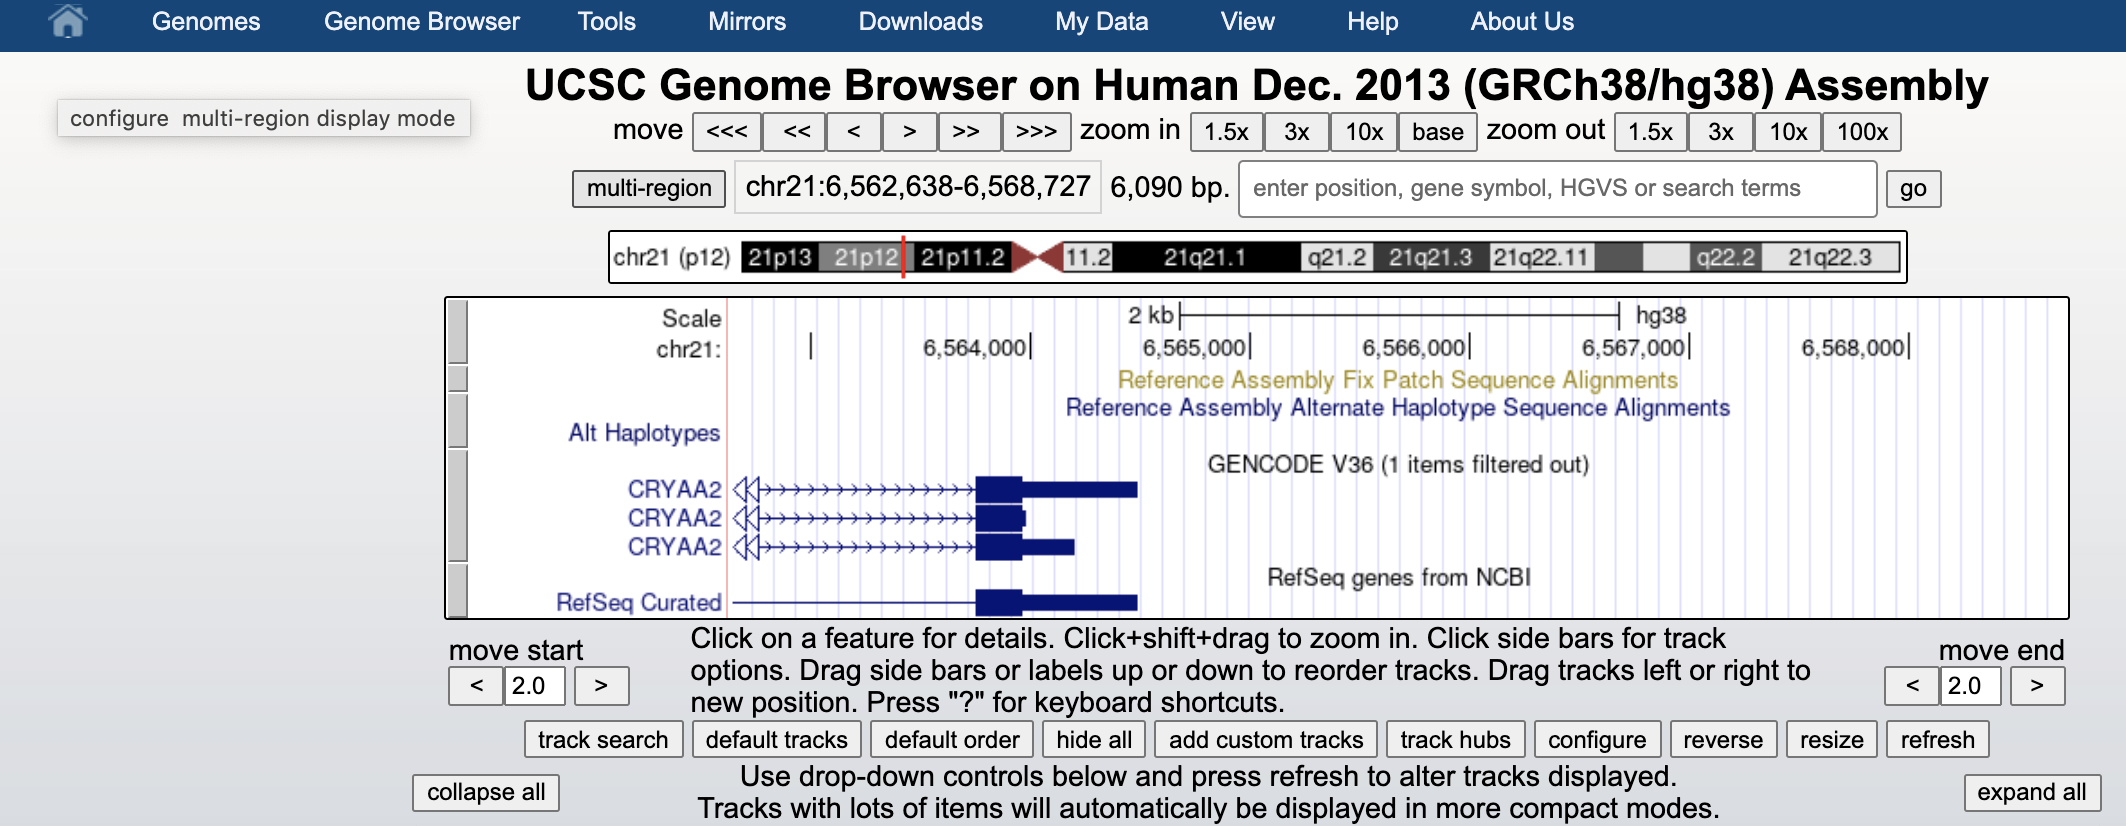
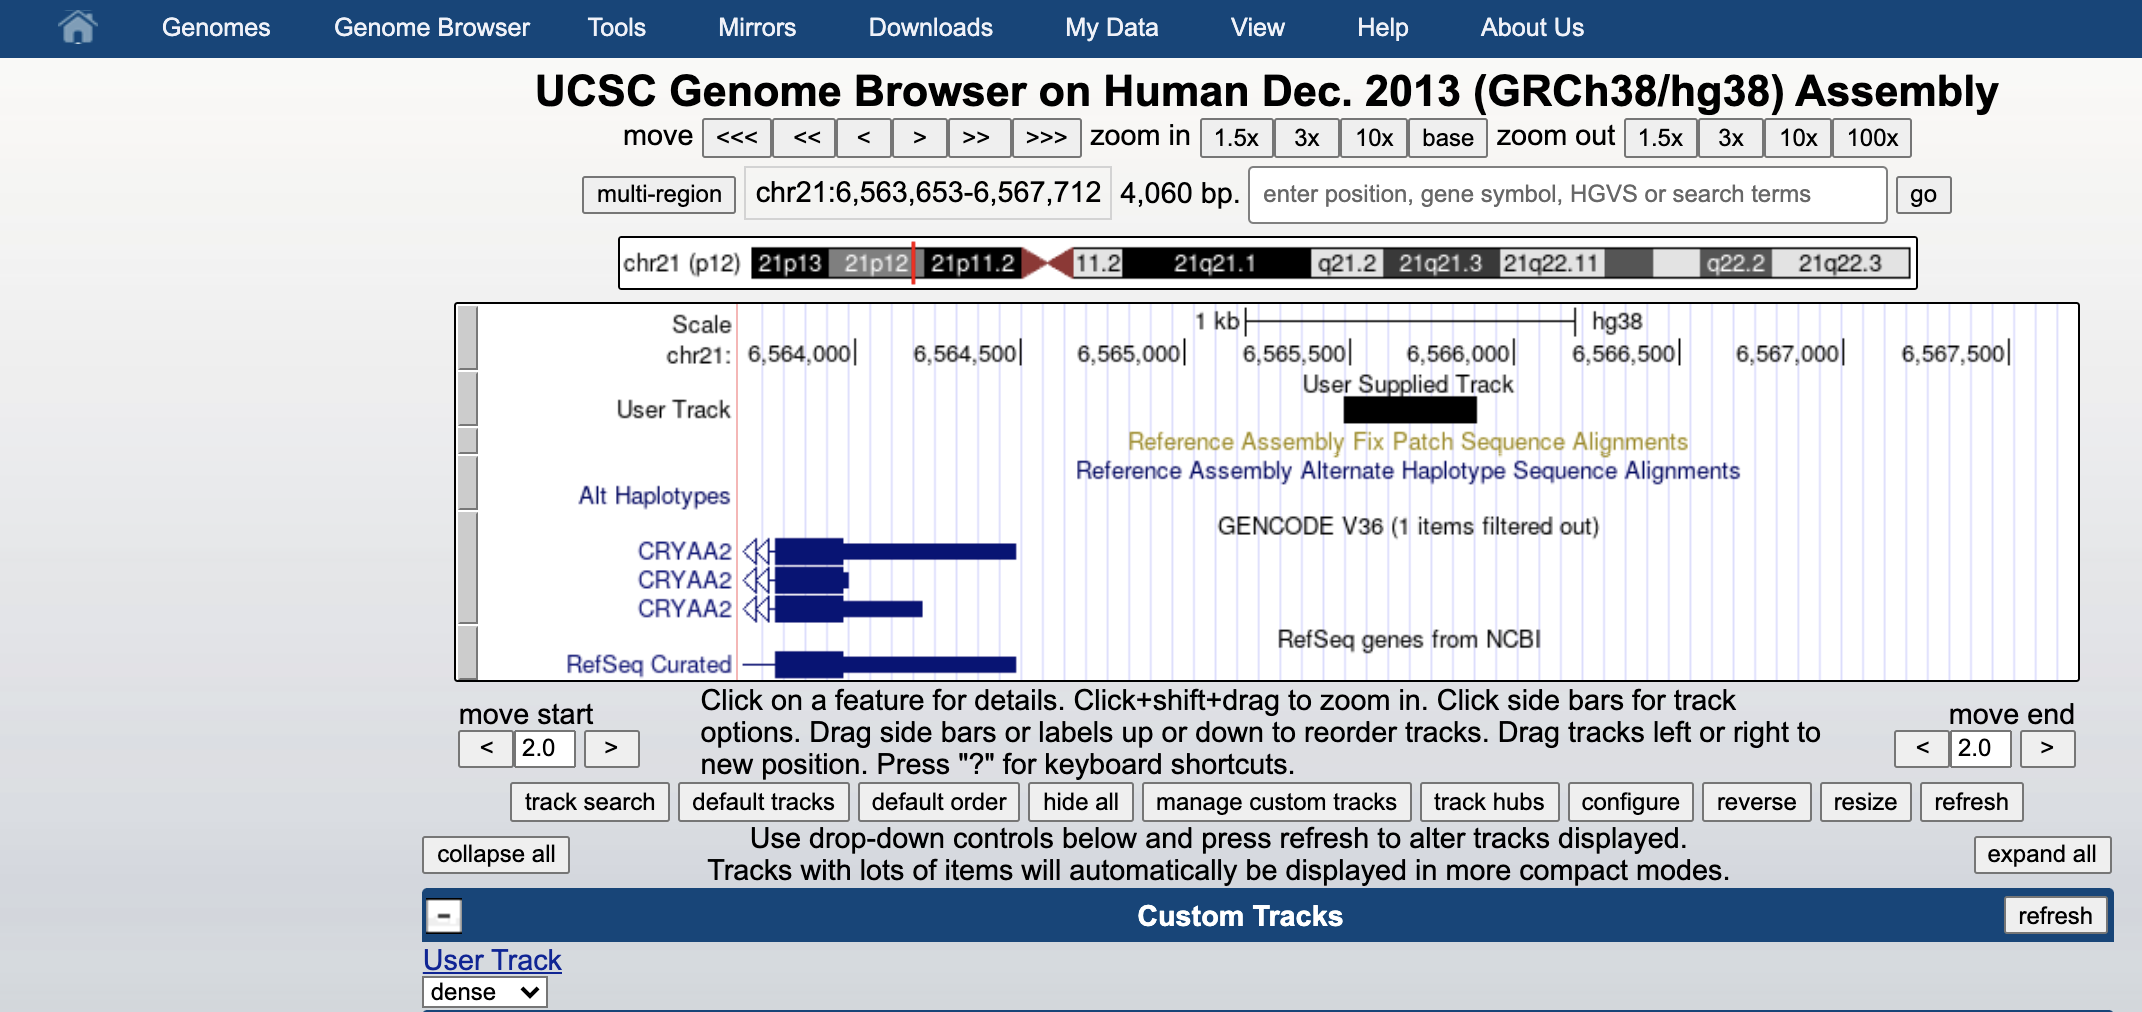
Then we can either upload our file or cat it and copy paste in the window. Then you click on submit and go to go to the genome browser.
You can see it as black bar in the genome browser.
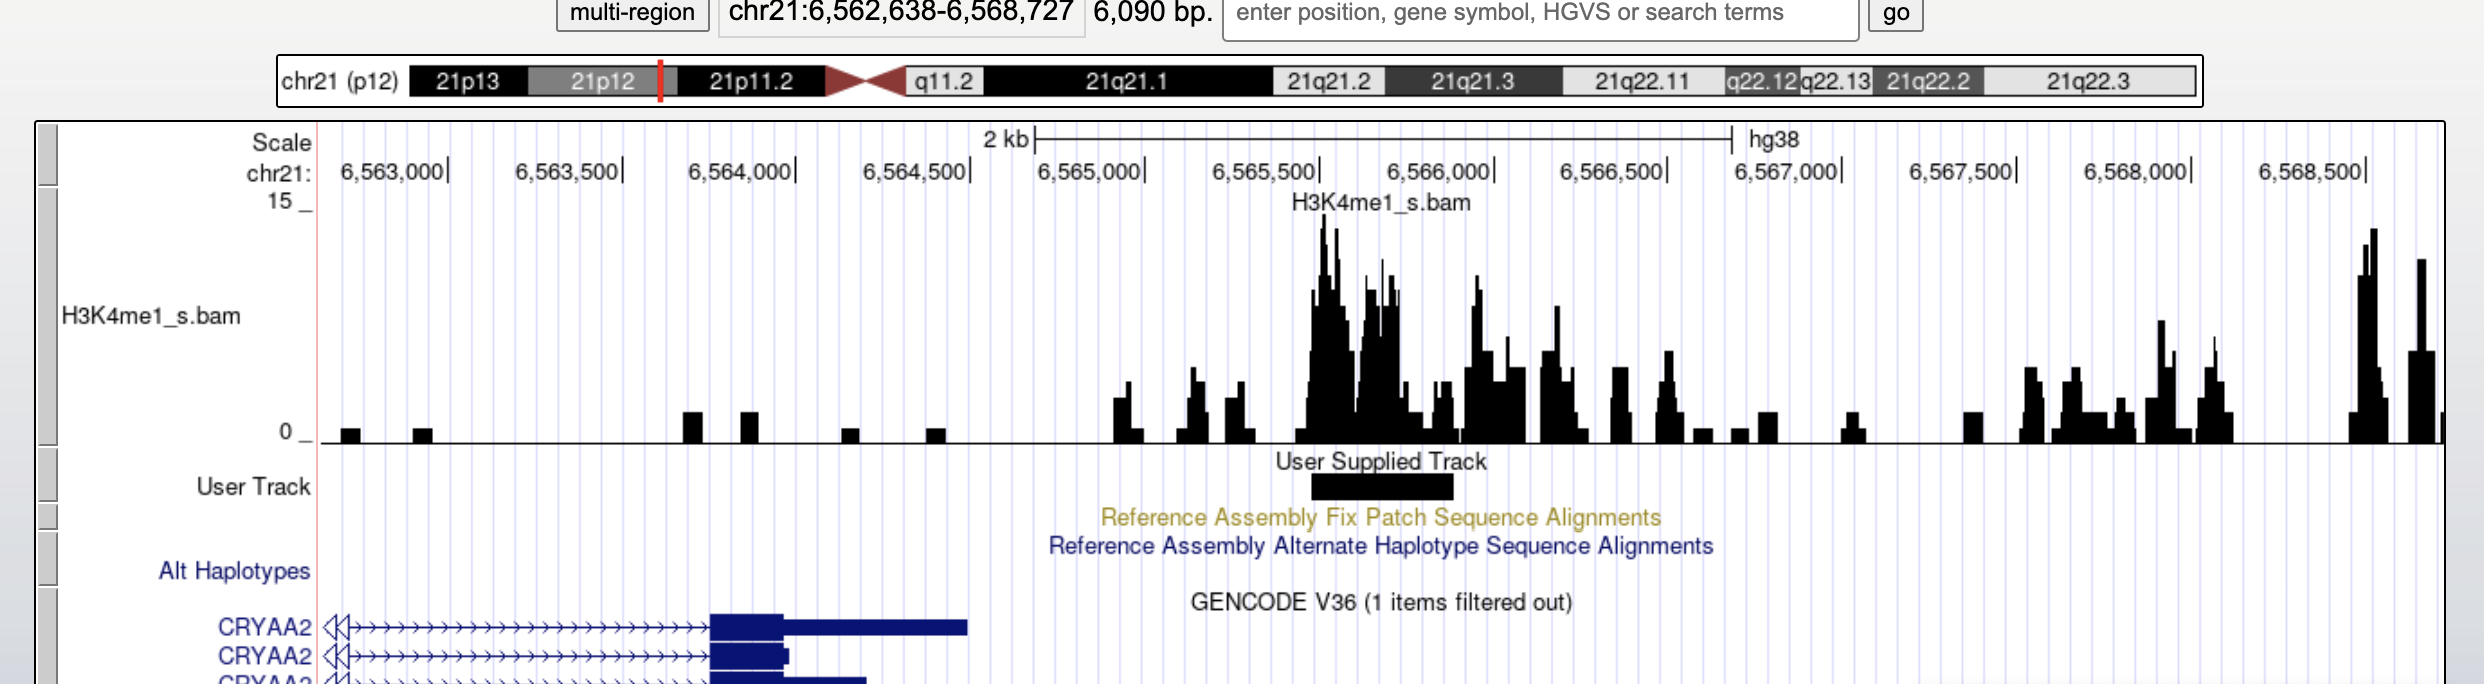
You can also display aligned sequences, but you need to place your sorted and indexed bam files in a web-server. Then you can just paste the corresponding web-link into the same custom track space to let the browser directly fecth the needed informations on the fly.
Copy paste this link into the custom track. This is the sorted version of our alignment, hosted in the github web-server.
https://biocorecrg.github.io/PhD_course_genomics_format_2021/data/H3K4me1_s.bam
In the same place we also hosted the index, called H3K4me1_s.bam.bai. When you don’t specify it, the browser will automatically look for the index just adding .bai ad the end of the link we provide.
Once submitted let’s change the display to Display Mode -> FULL and click the checkbox Display data as a density graph.
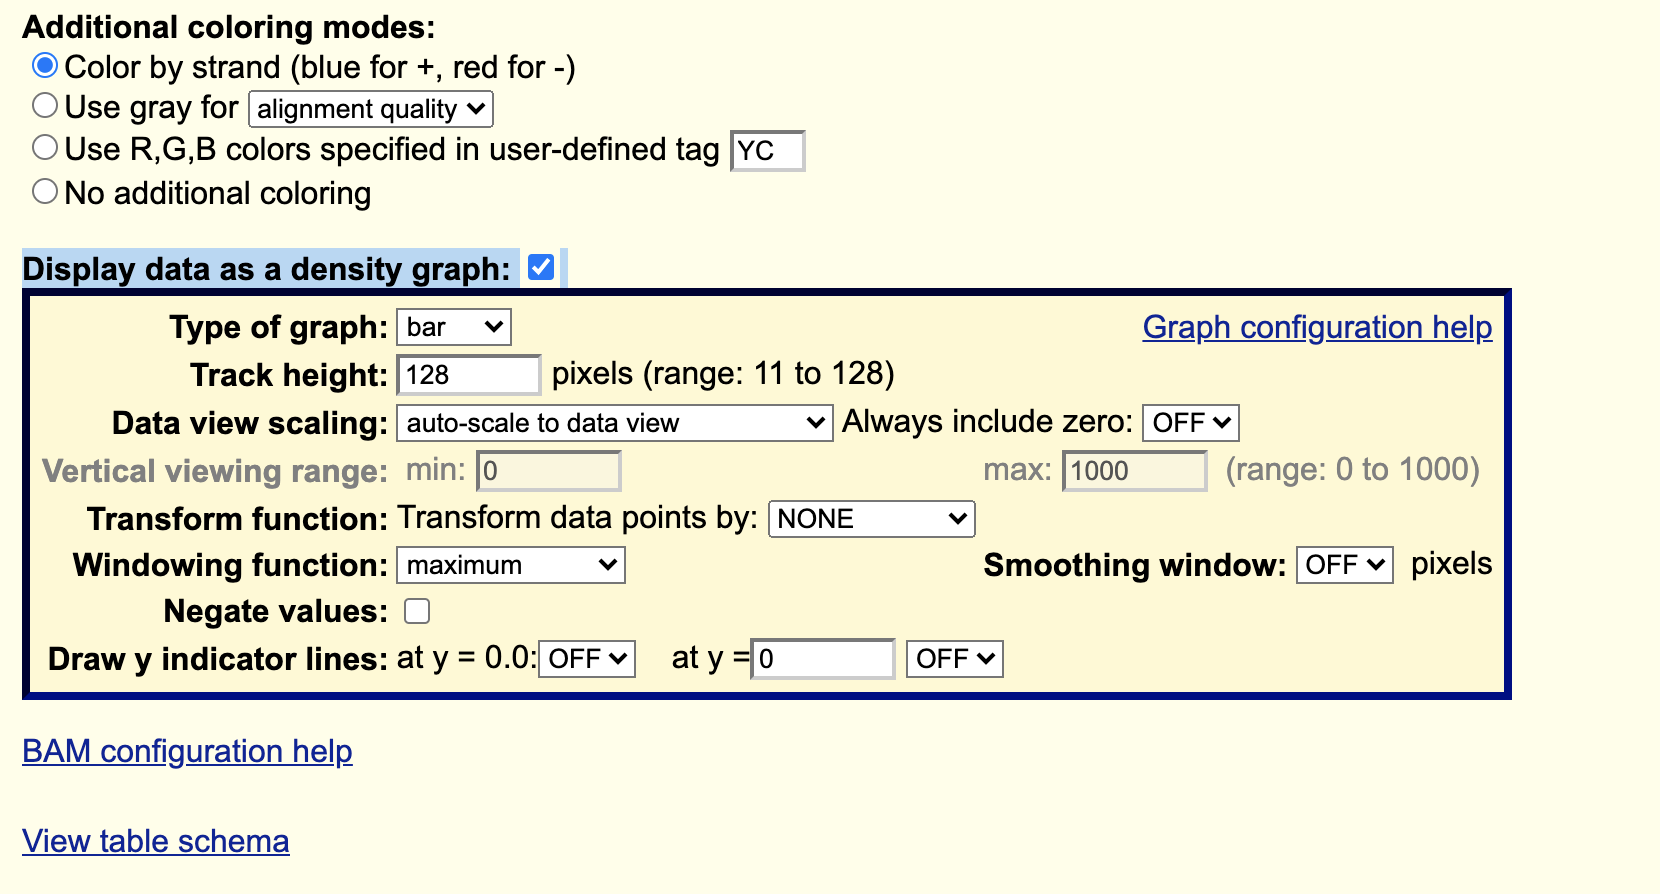
You will see the coverage of your mapped reads together with the called peaks.