

Assessing gene expression
Central dogma of molecular biology:

The quantity of mRNA for a single gene directly reflects how much transcription of that gene has occurred.
By determining which mRNA transcripts are present in a cell, we can assess which transcripts/genes are expressed in that cell (comparatively).
What is a transcriptome?
A transcriptome is the full range of messenger RNA - or mRNA - molecules expressed by an organism.
Some techniques for measuring gene expression
All techniques work by measuring levels of mRNA in the sample.
Northern blot
A Northern blot can measure the intensity of one gene at a time.
Protocol overview:
- mRNA isolation: a protease breaks the cell membranes and releases the genetic material.
- Separation of mRNA molecules by gel electrophoresis.
- Blotting: transfer of RNA to a filter/membrane
- Incubation with a radioactive-labeled probe (complementary to the gene of interest)
- Visualization of labeled RNA intensity on X-ray film


What is the unit of measure of expression?
X-ray/radiographic intensity/density.
Real-Time PCR
Real-Time PCT (RT-PCR) combines the conversion of RNA to cDNA and the amplification of specific targets using Polymerase Chain Reaction (PCR).
The basic steps for the RT-PCR are the following:
- Conversion of RNA into double stranded cDNA using a reverse transcriptase.
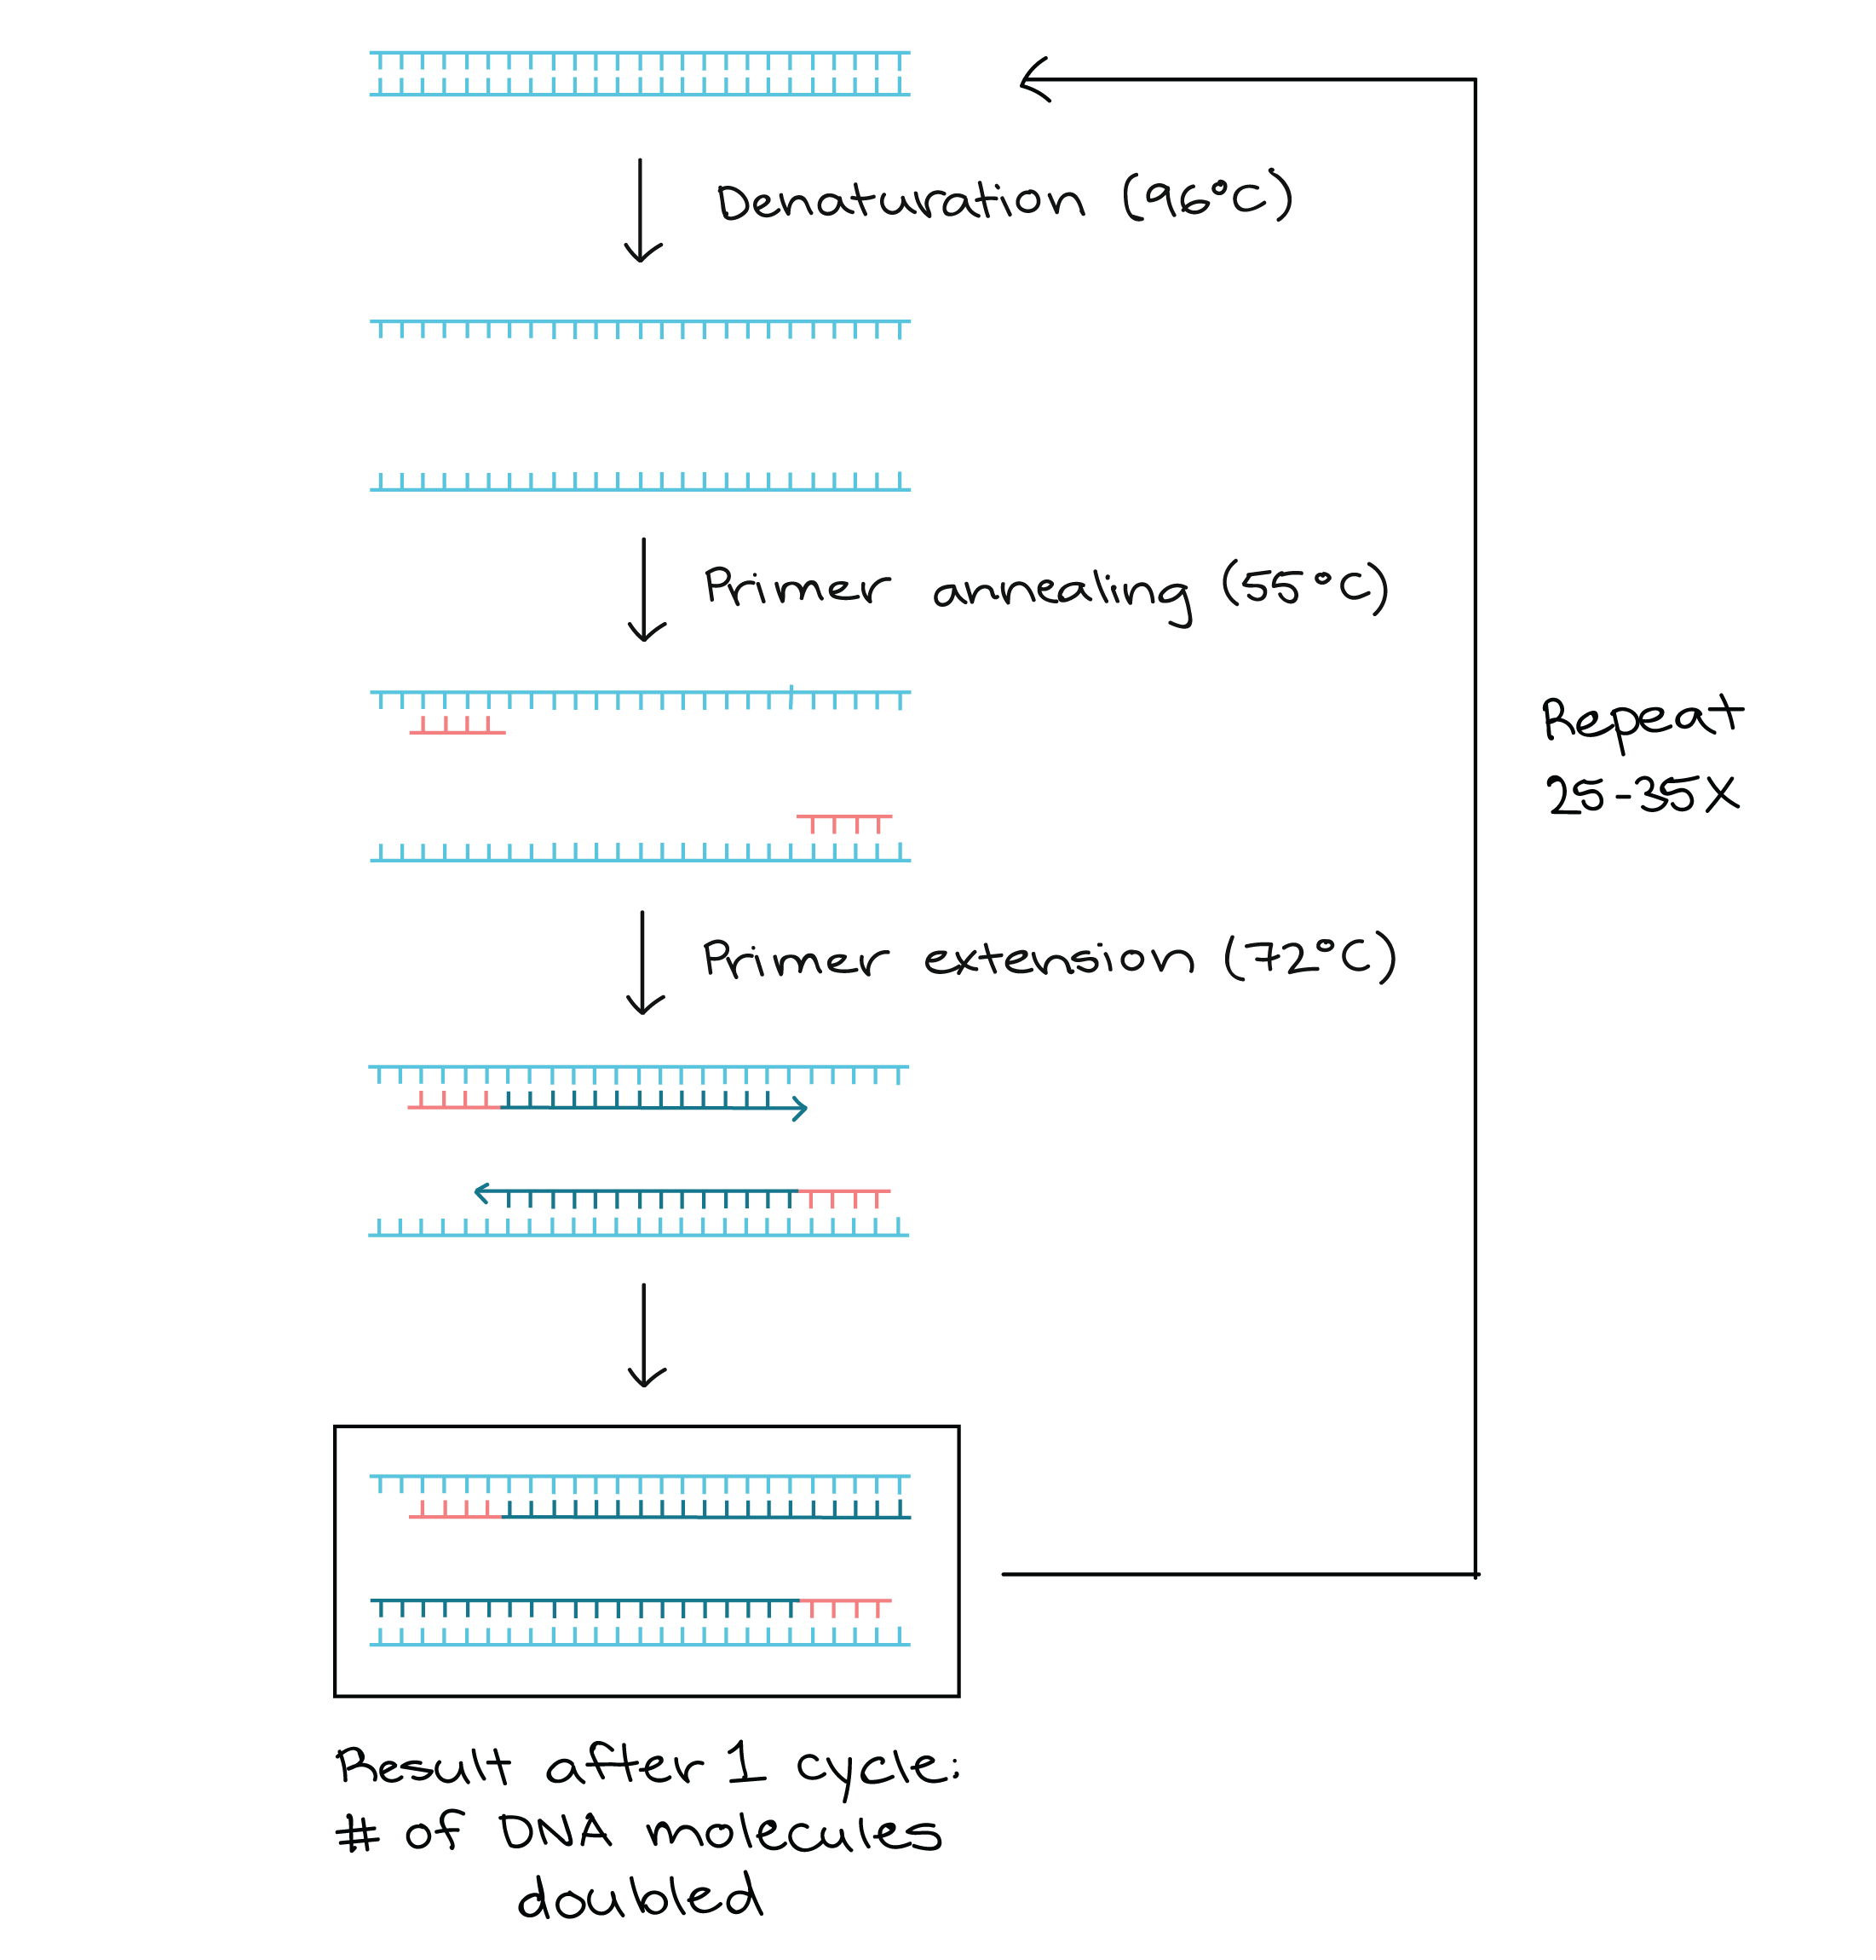
- Denaturation: cDNA denaturation by high temperature (94-98oC): the heat makes the hydrogen bonds between the 2 strands of cDNA break, yielding 2 single strands of DNA.
- Annealing: At 50-65oC, primers are annealed to the single strands of cDNA.
- Extension: The temperature is risen for the DNA polymerase to properly function (typically ranging from 70-80oC, depending on the enzyme used) and synthesize a new DNA strand complementary to the template.

Source
The processes of denaturation, annealing and elongation constitute a single cycle. Multiple cycles are required to amplify the DNA target to millions of copies.
The cycle repeats typically 25-35 times in a typical PCR reaction.
What is the unit of measure of expression?
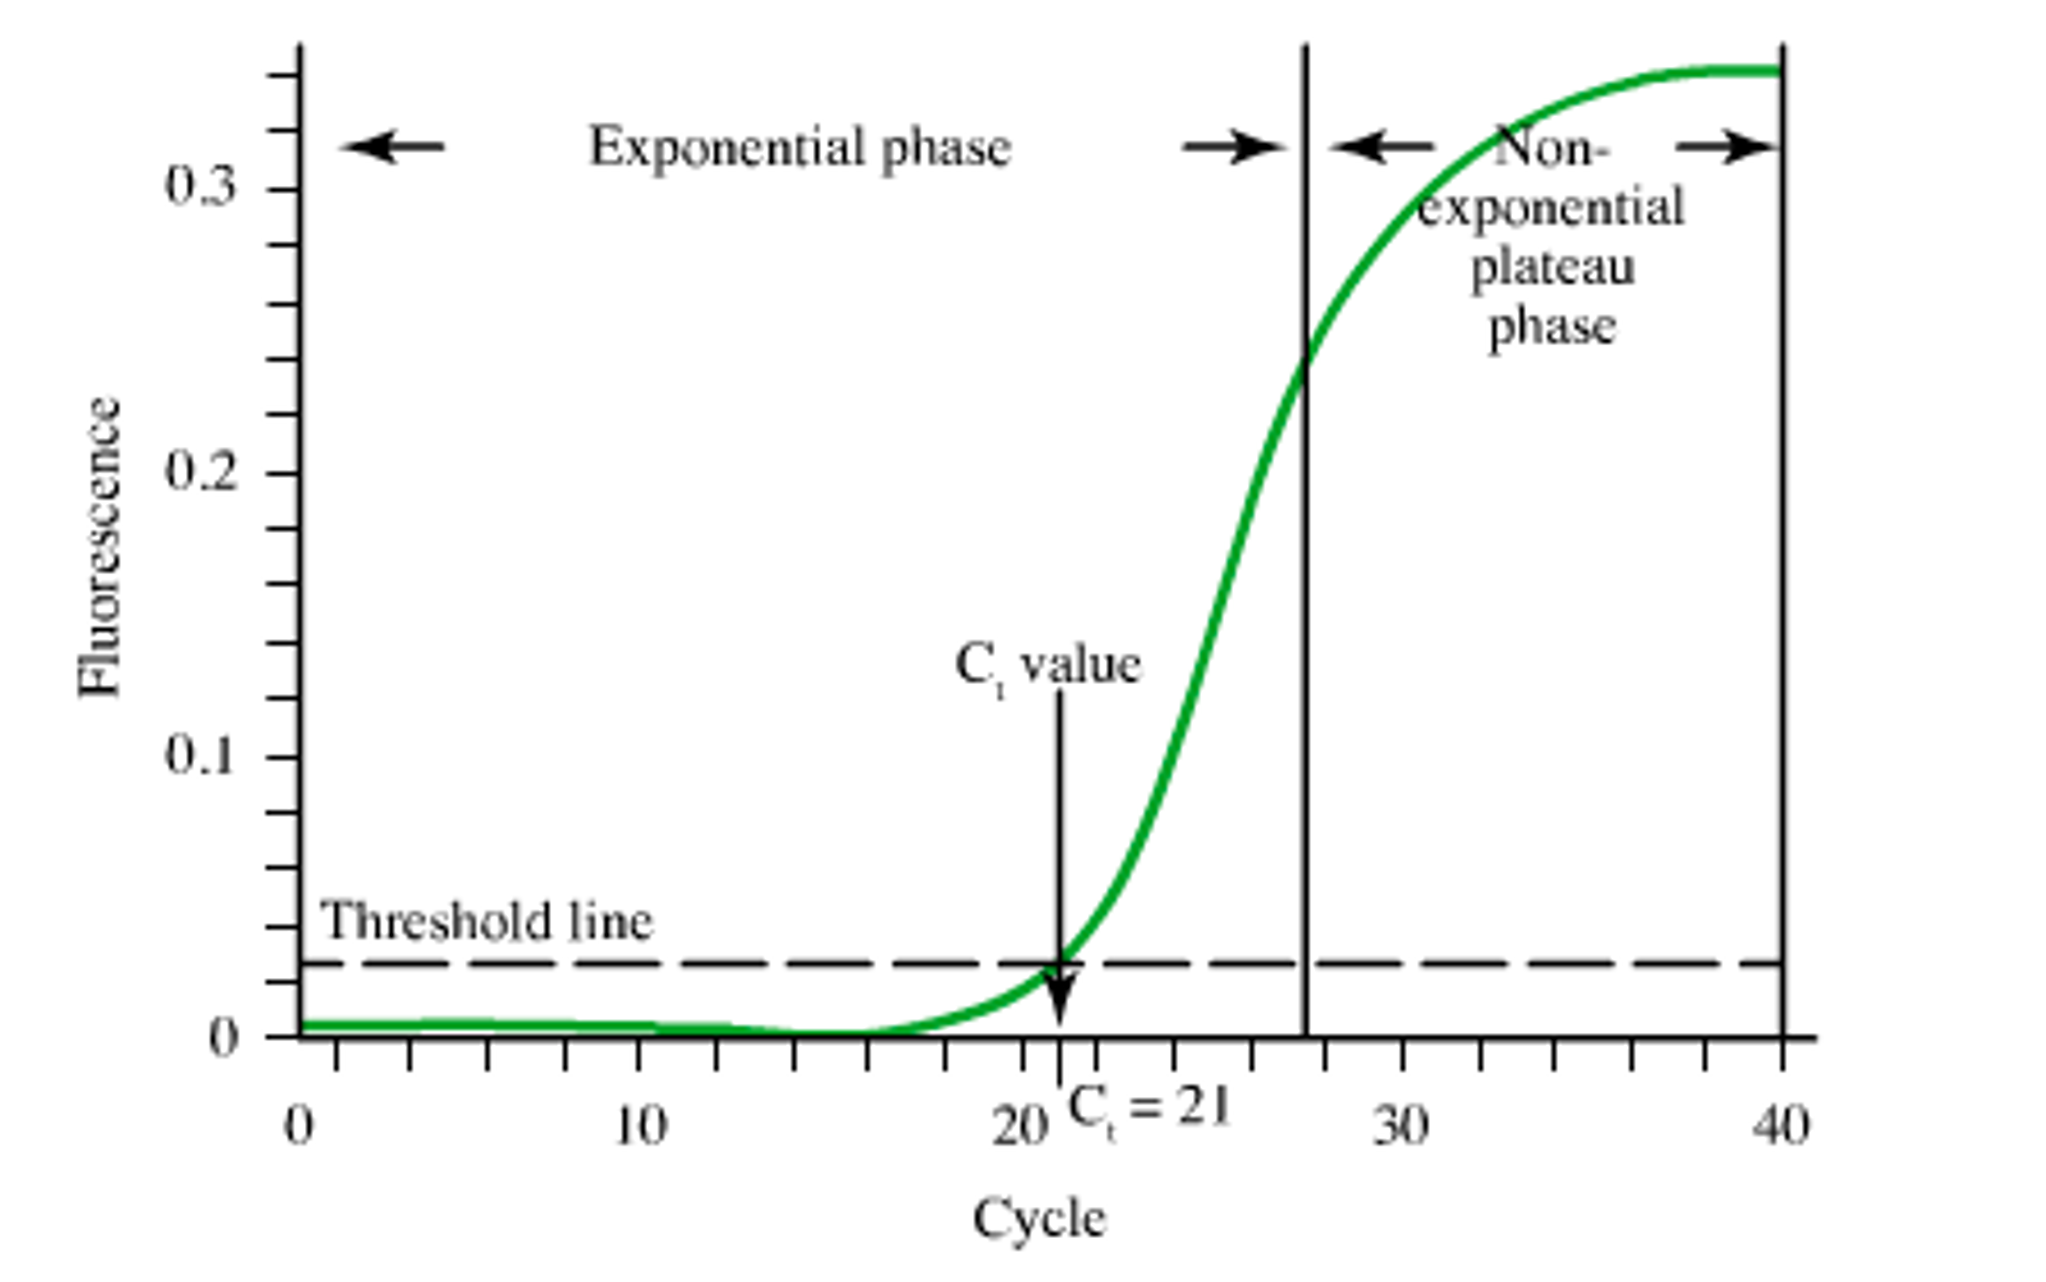
Ct (cycle thrshold): the less cycles the higher expression.
The Ct is defined as the number of cycles required for the fluorescent signal to cross the threshold (i.e. exceeds background level).
Gene expression microarrays
Gene expression microarrays were first developped in the mid-1990s. They are the first technique that can measure gene expression from a thousand of genes simultaneously (high throughput).
Typical protocol:
- mRNA extraction
- Reverse transcription of mRNA to cDNA
- Labeling of cDNA molecules (fluorescent or luminescent dyes)
- Hybridization of cDNA onto the array/slide (cDNA hybridizes on probes complementary to genes).
- Scanning of hybridization signals -> Images
- Image analysis -> Raw data
- Bioinformatics analysis

What is the unit of measure of expression?
Fluorescence / luminescence: the higher the signal, the higher the expression.
mRNA sequencing
RNA-sequencing, aka RNA-seq, is a High-Throughput Sequencing (HTS) technique for identifying and quantifying RNA molecules in biological samples.
| RNA-Seq summary |
|---|
 |
| from Wikipedia |
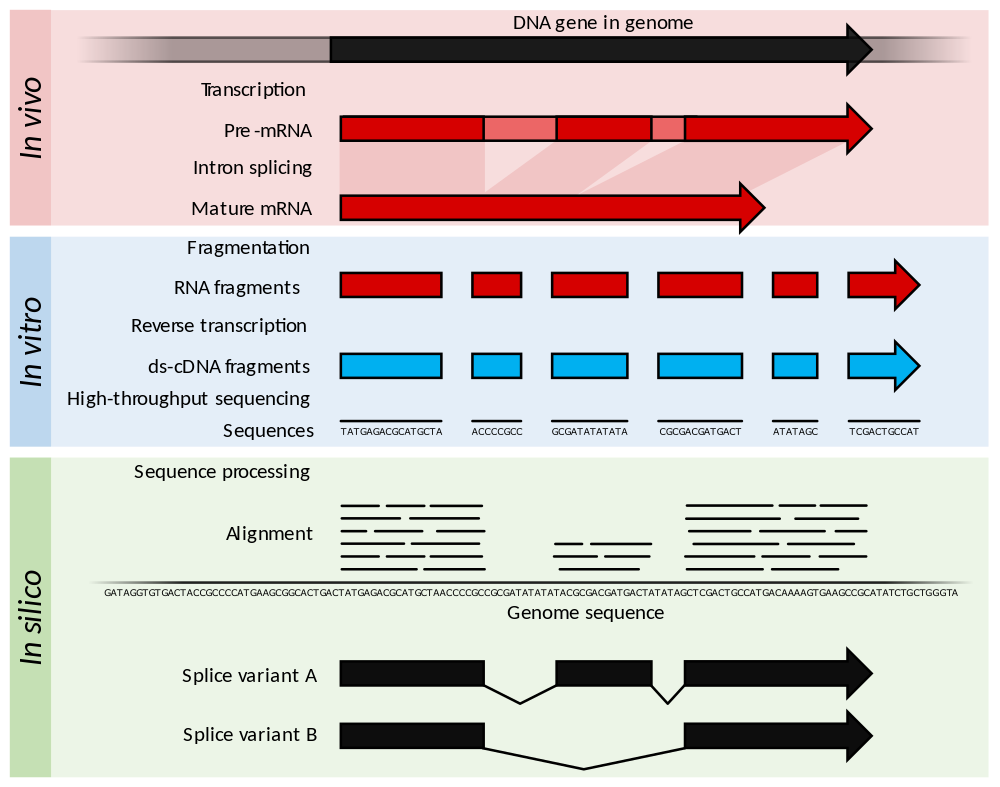
This technology is used to analyze RNA for assessing:
- RNA/gene/transcript expression (targetting mRNA)
- alternatively spliced transcripts
- gene fusion and SNPs
- post-translational modification
| Workflow of mRNA-seq |
|---|
 |
| from Sudhagar et al., Int. J. Mol. Sci. 2018 |
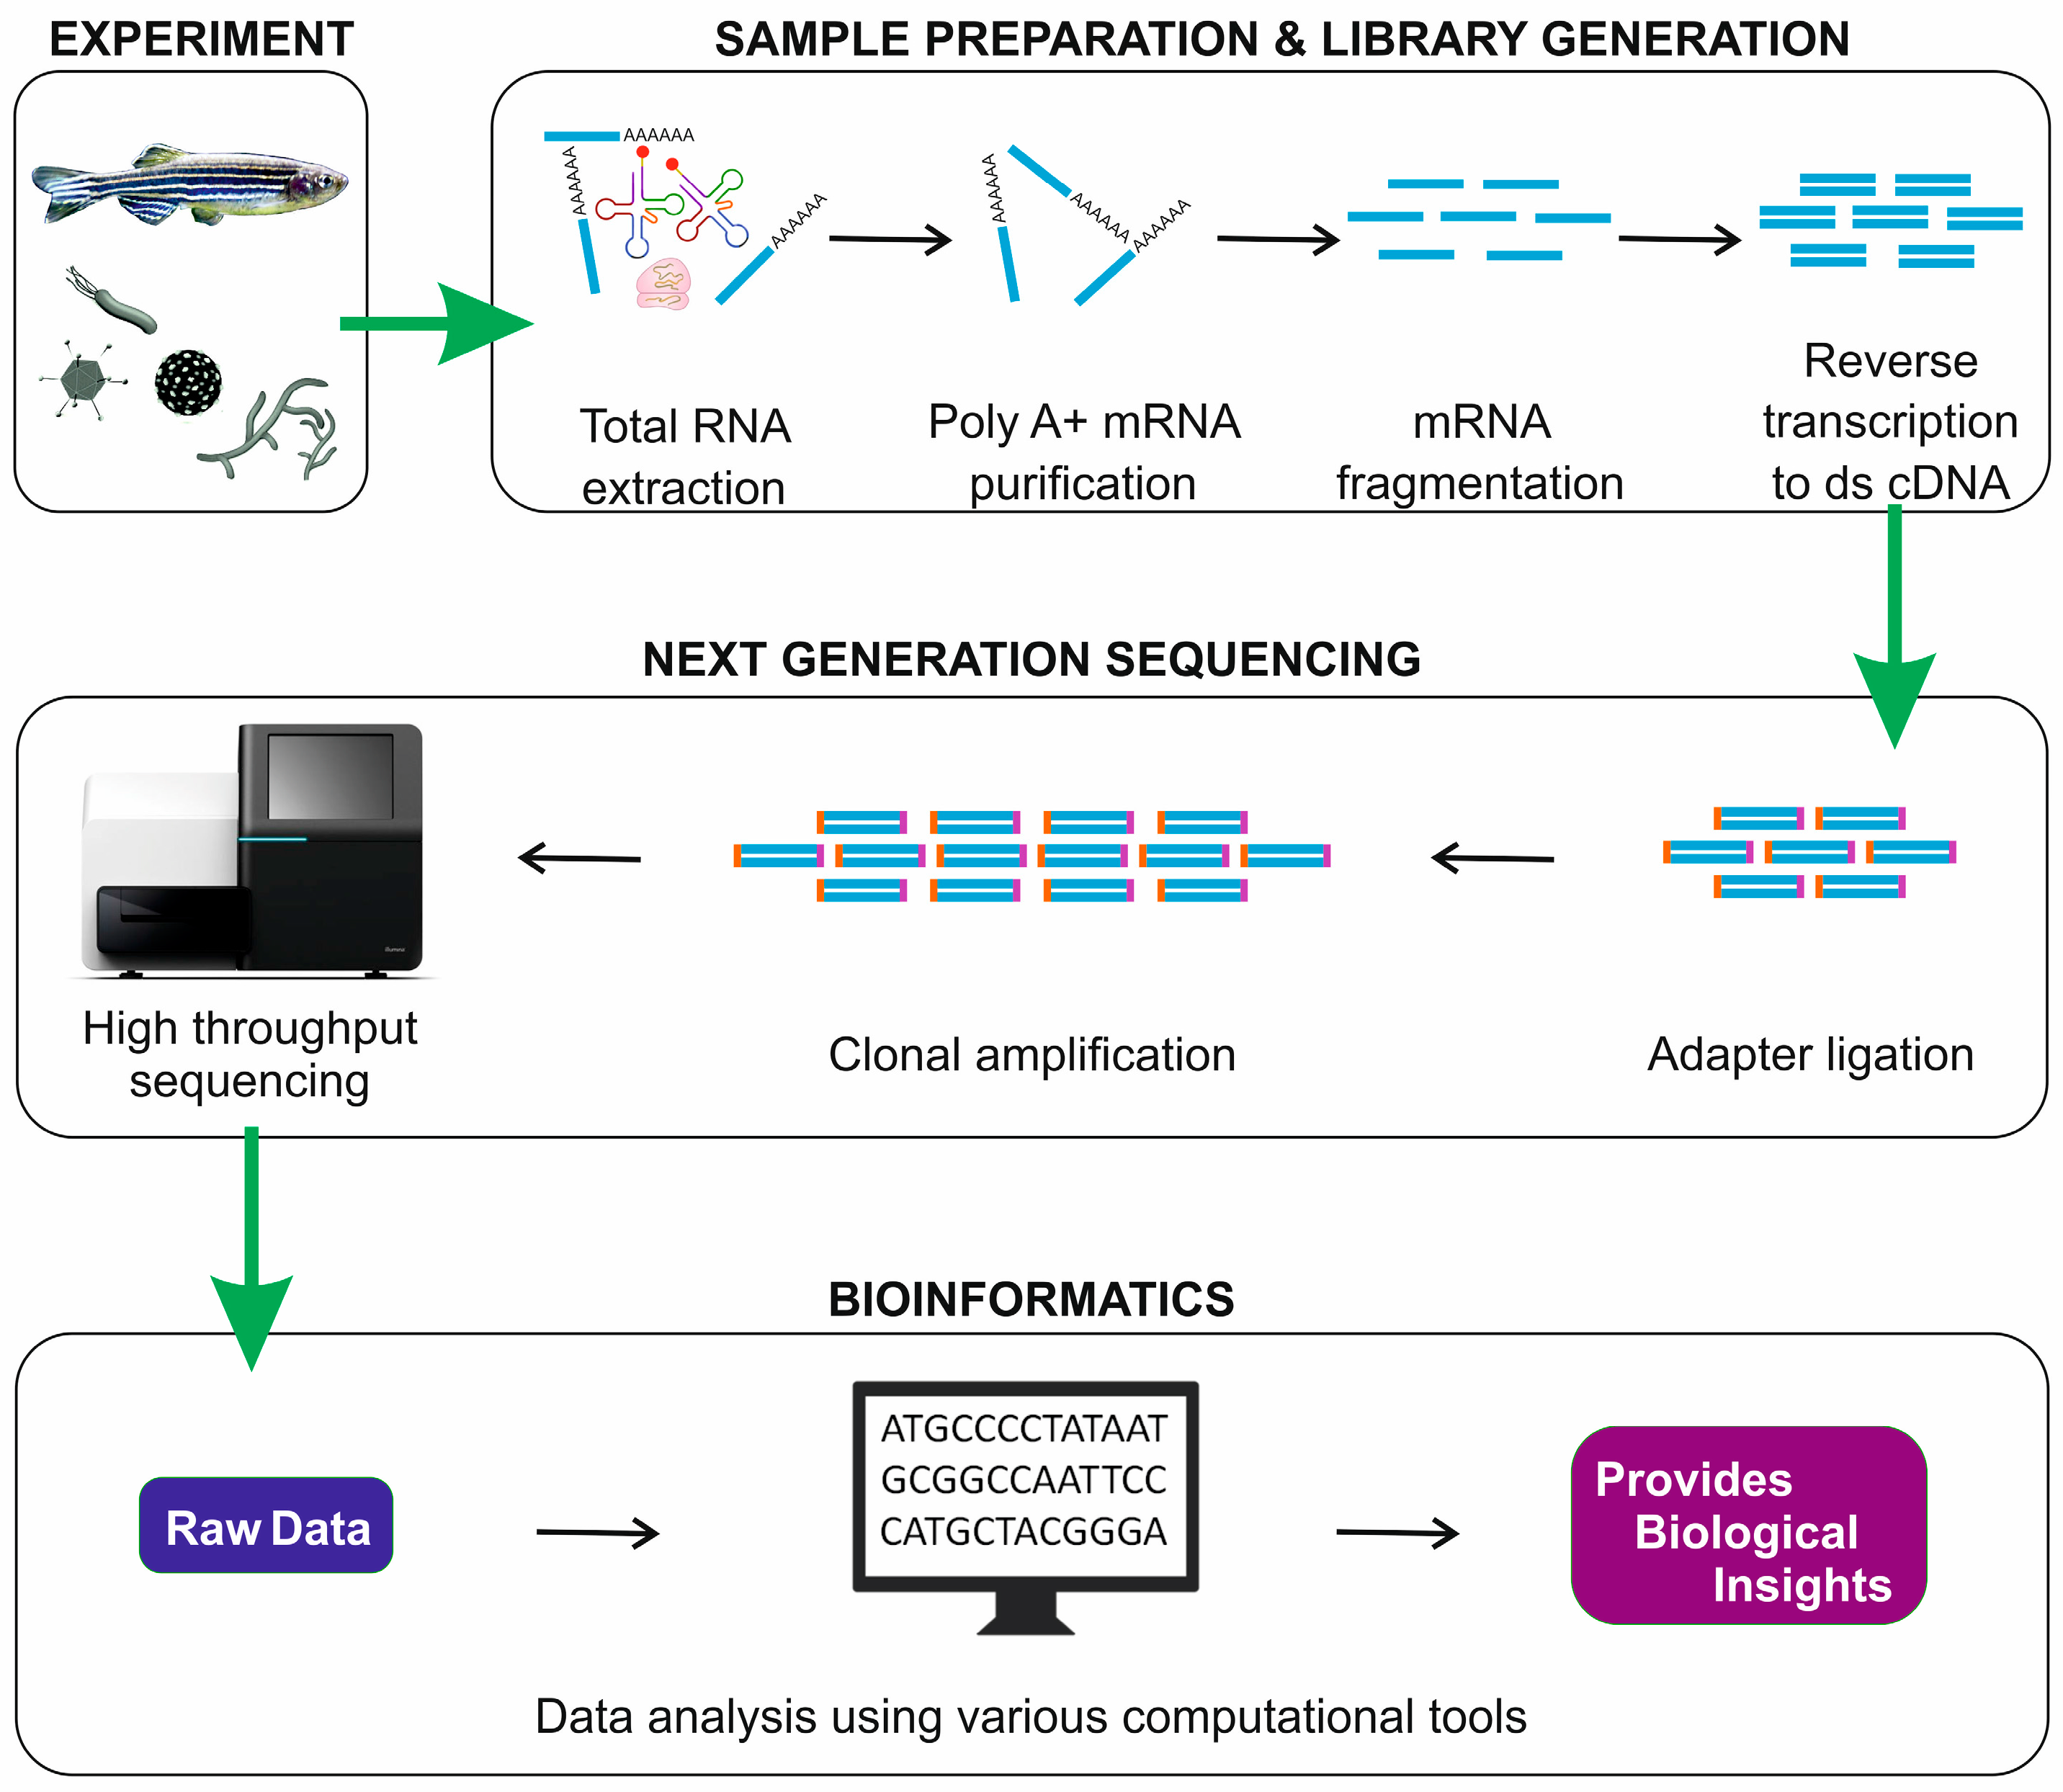
mRNA sequencing conventional workflow consists of four major steps:
- Experimental design.
- Sample preparation and library generation.
- High-Throughput Sequencing of the library -> reads (typicall short 50-150bp sequences) are obtained.
- Bioinformatic analysis of the reads.
What is the unit of measure of expression?
Number of reads (sequences) that match a particular gene/transcript: the more reads the higher the expression.
Gene expression public repositories
The main repositories for gene expression data, from peers or consortia:
- SRA (Sequence Read Archive)
- NCBI repository for raw and processed data from the scientific community.
- GEO (Gene Expression Omnibus)
- Linked to SRA
- Array-express
- EMBL-EBI repository for raw and processed data from the scientific community.
- Gene expression atlas
- Linked to Array-express
- GTEx (Genotype-Tissue Expression)
- ENCODE (Encyclopedia of DNA Elements)
We will have a look at a few of these repositories.
GEO
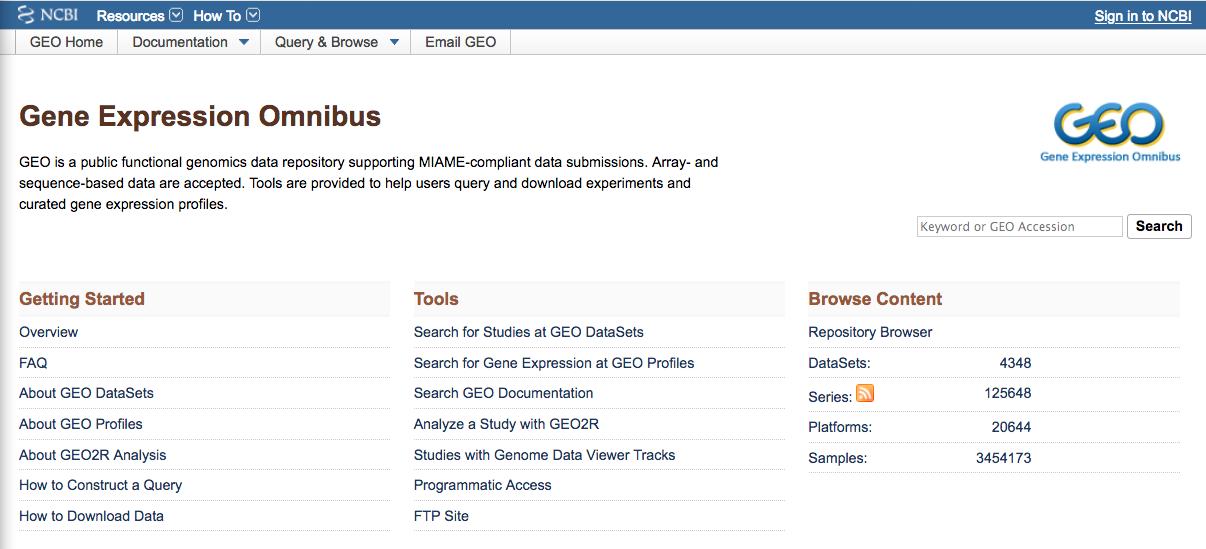
GEO (Gene Expression Omnibus) is a public functional genomics data repository: it archives and freely distributes data sets generated from microarray and sequencing-based experiments.
Upon publication, journals typically ask to deposit raw and processed data, coming from the high-throughput experiments, to GEO.
GEO records/data sets are organized as follows:
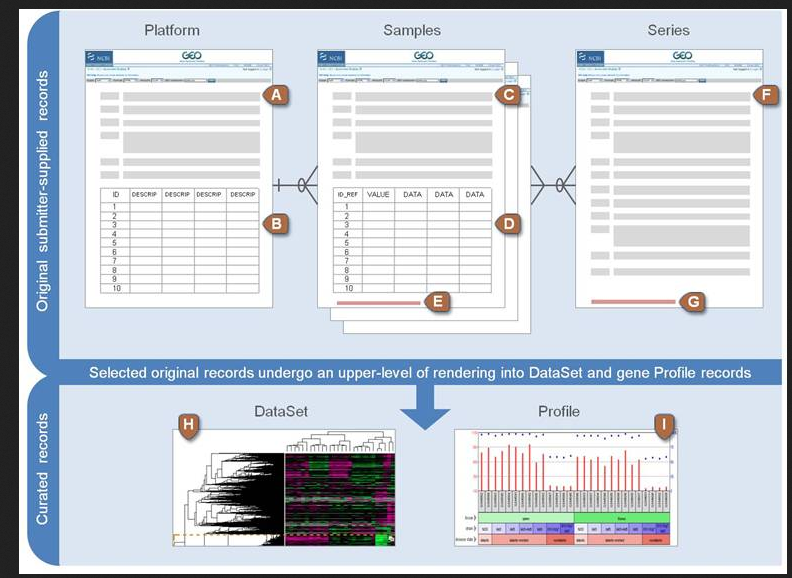
Platform, Samples and Series are submitted by the submitter (scientist):
- Platform: description of array or sequencer.
- Code GPLxxx
- Samples: conditions under which individual was handled.
- Code GSMxxx
- Series: link together a group of related samples and provides a description of the whole study.
- Code GSExxx
After GEO curation:
- DataSet: collection of biologically and statistically comparable GEO samples.
- Code GSDxxx
- Profiles: derived from DataSets: expression measurements of an individual gene across all samples un a DataSet.
EXERCISE
Go to the page for Series GSE36314:
- How many samples does this series contain? From which organism?
- What was the platform used?
- What DataSets do this series belong to? (Find Query DataSets.. in the page)
- Go to the platform page of series GSE36314
- Can you find what gene corresponds to probe 37928_at ?
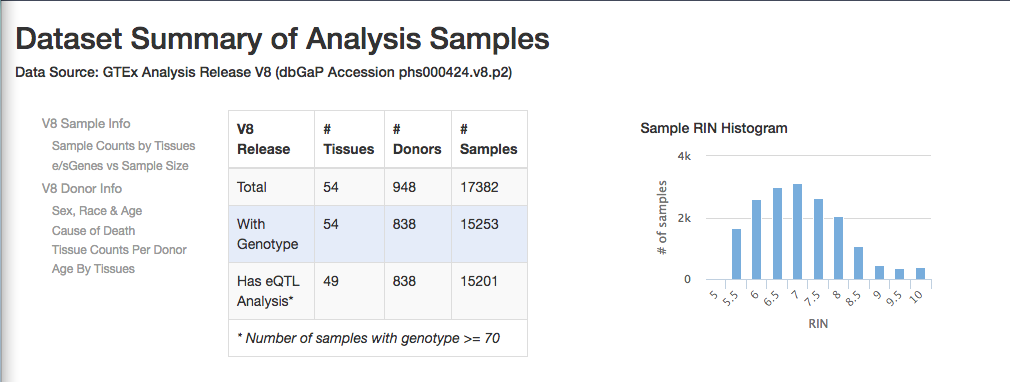
GTEx
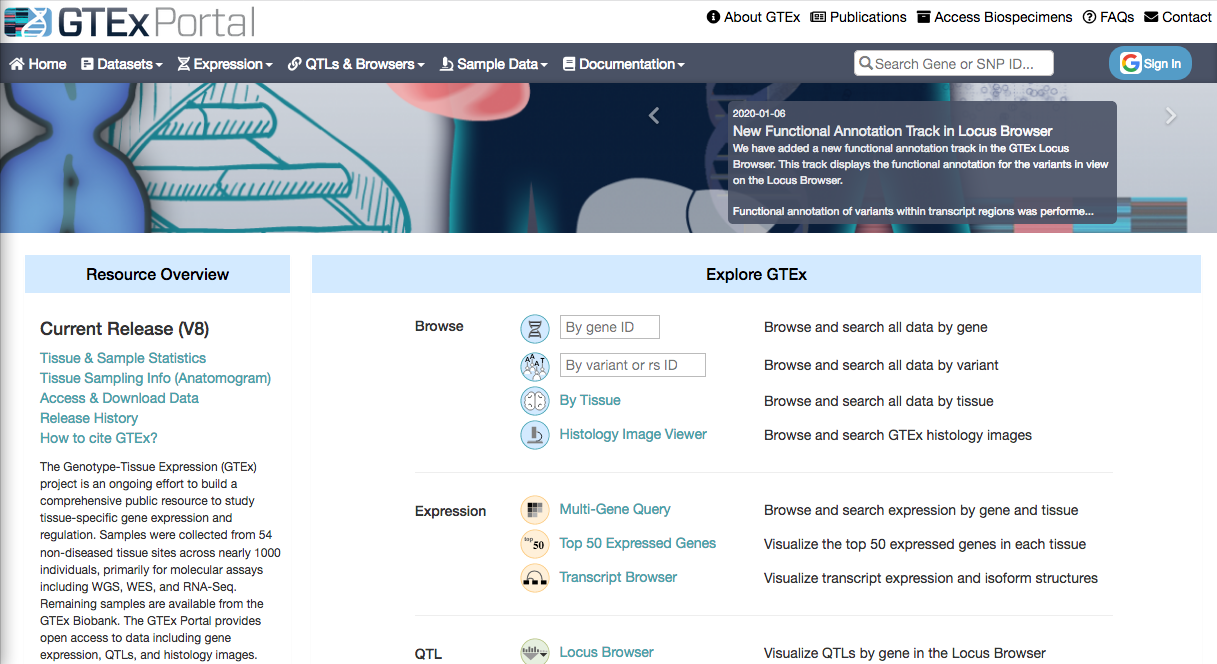
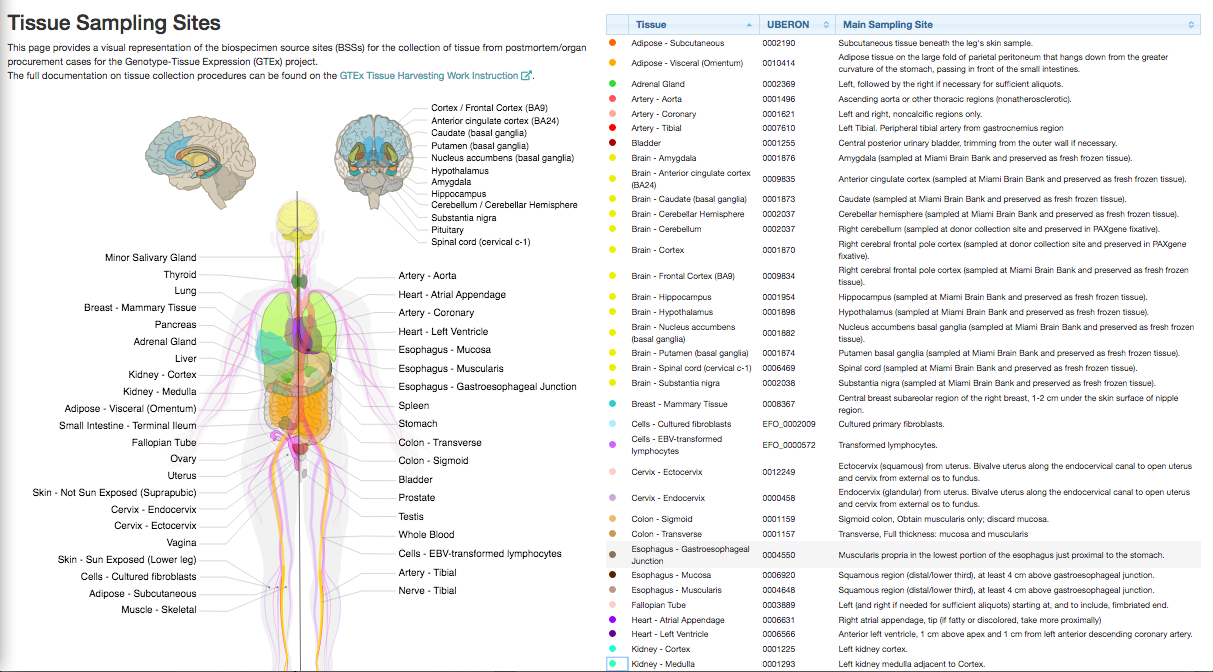
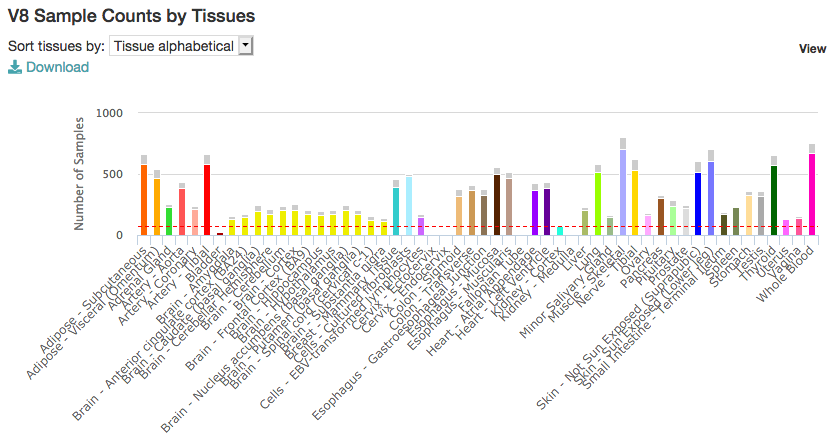
The NIH-funded GTEx (Genotype-Tissue Expression) consortium aims at building a comprehensive public resource to study tissue-specific gene expression and regulation in Homo sapiens individuals.
Samples were collected from 54 non-diseased tissues sites across nearly 1000 individuals.
The latest version v8 was released in 2019:
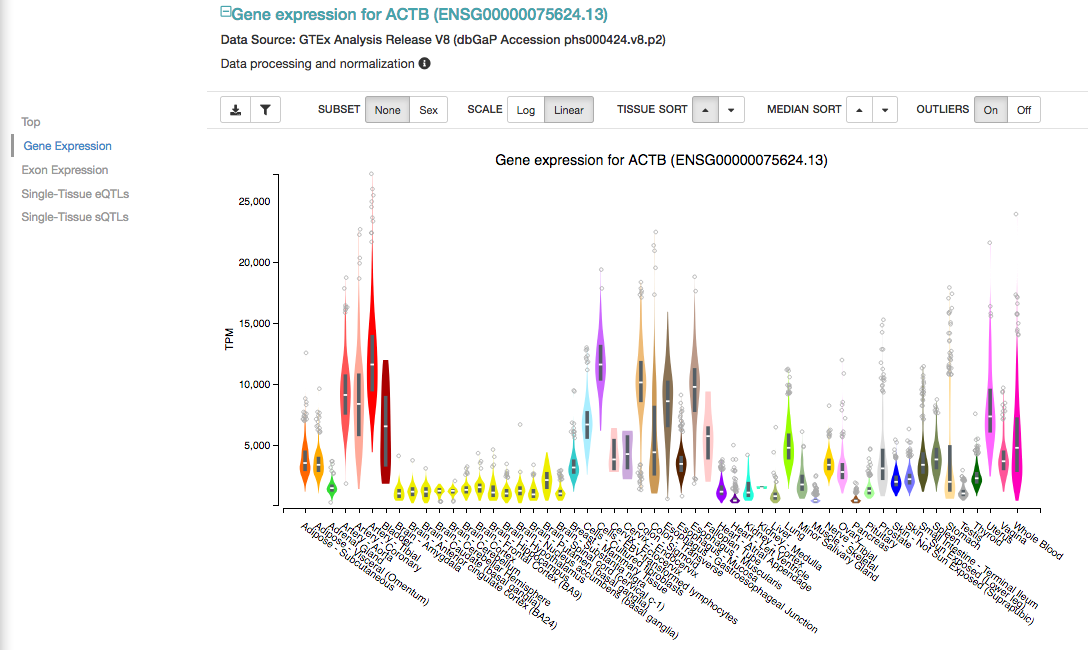
From the main page, you can access the gene expression portal and look for a particular gene (e.g. ACTB)
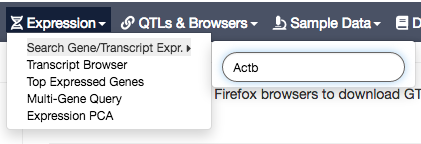
Click on Gene expression (left panel), to see the expression of that gene across all studied tissues:
You can also query several genes at the same time, and select the tissues of interest, with the Multi Gene Query:
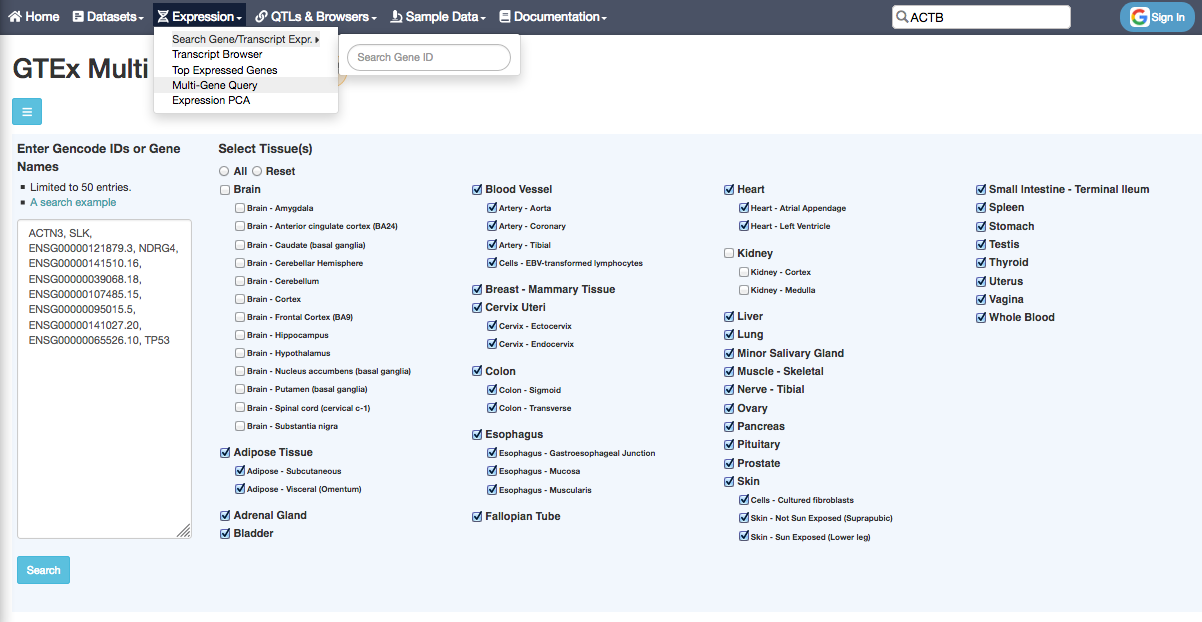
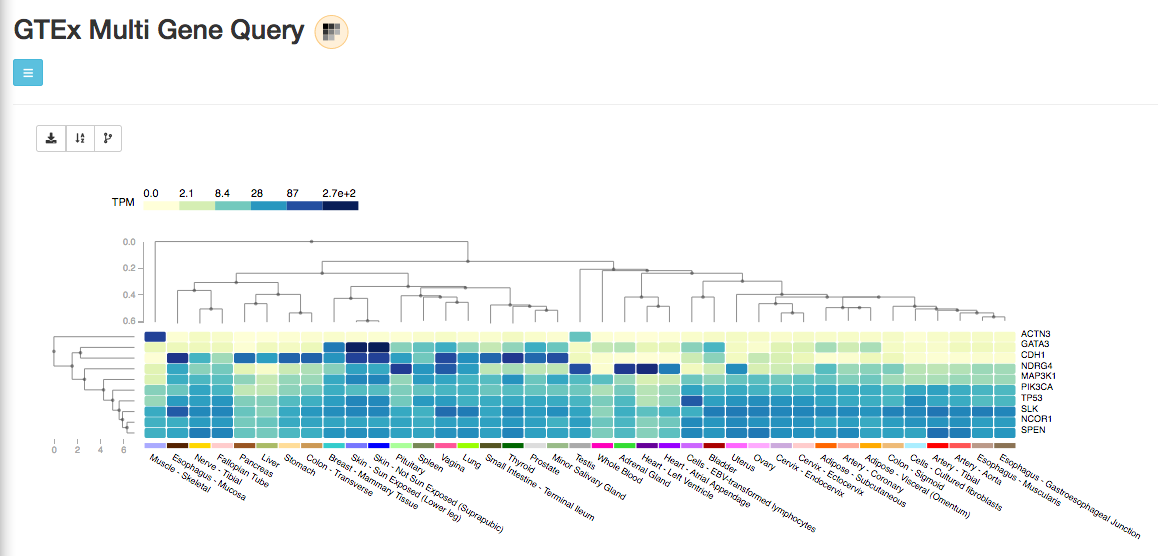
NOTE that gene expression here is expressed in TPM units.
TPM stands for Transcript Per Million and measures the proportion of each transcript in a pool of all transcripts.
For example, if in a sample, the TPM value for the transcript A is equal to 1000, it means that among one million of all transcripts in this sample there are 1,000 transcripts A; and if the TPM value for the transcript B is 10,000 - there are 10,000 transcripts B; that is, the sample has 10 times more transcripts B than transcripts A; and we can say that transcript B is expressed 10 times higher than transcript A in this sample.
(TPM for transcript i) = (read count for i) / (length of i) * 1,000,000 / (normalizing factor)

(normalizing factor) = SUM over all transcripts [ (read count for j) / (length of j)]
Important.
Despite TPM is used by GTEx and many other databases / tools to compare transcript/gene expression across samples, in theory, TPM values are not suitable for comparison between different samples, because TPM doesn’t account for differences in library composition and the normalizing factor might be therefore different for different samples.
TPM is also very dependent on a few highly expressed genes that may not be the same between samples.
EXERCISE
- Search the expression of gene STMN2 across tissues: in which groups of tissues is that gene more expressed?
- Now do a multi gene query based on the following genes: STMN2, NEFL, DNM1, TPPP, SNAP25, PMP2, ONLY on brain tissues. Which of those 6 genes is most highly expressed in the spinal cord?
- Go back to the GTEX main page. In transcript browser, search PMP2. Which of its exons is the most expressed in the spinal cord (brain)?
- Search the top 50 expressed genes for the spinal cord. What is the median TPM of the most highly expressed gene in the spinal cord? Which gene is it?
Gene expression atlas
The EMBL-EBI-funded Gene expression atlas gathers gene expression across species and biological conditions.
Expression profiles of tissues from Human Protein Atlas, GTEx and FANTOM5, and of cancer cell lines from ENCODE, CCLE and Genentech projects can be explored in Expression Atlas.
All data are manually curated, annotated to ontology terms allowing for much richer queries and re-analysed using standardised methods.
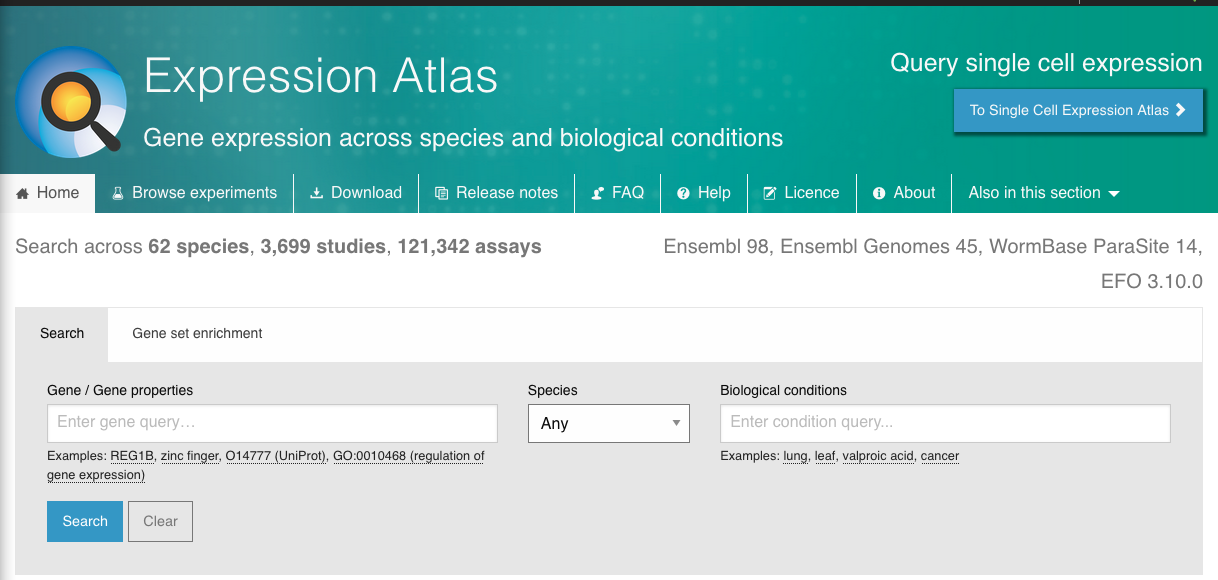
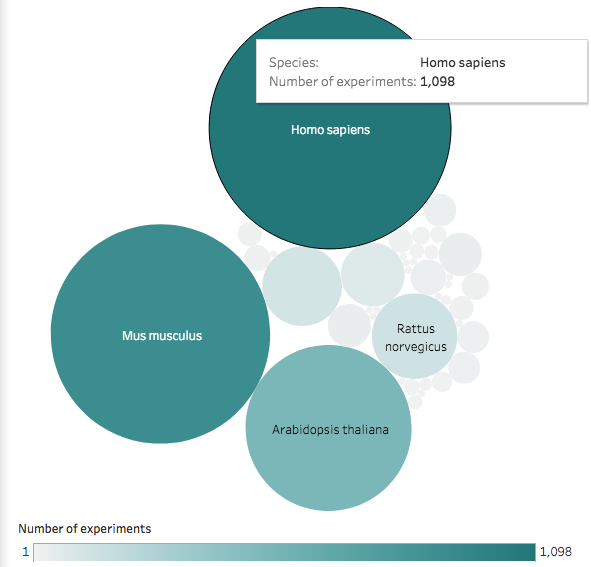
You can query a gene in the main page. By default, it will query that gene on all Species:
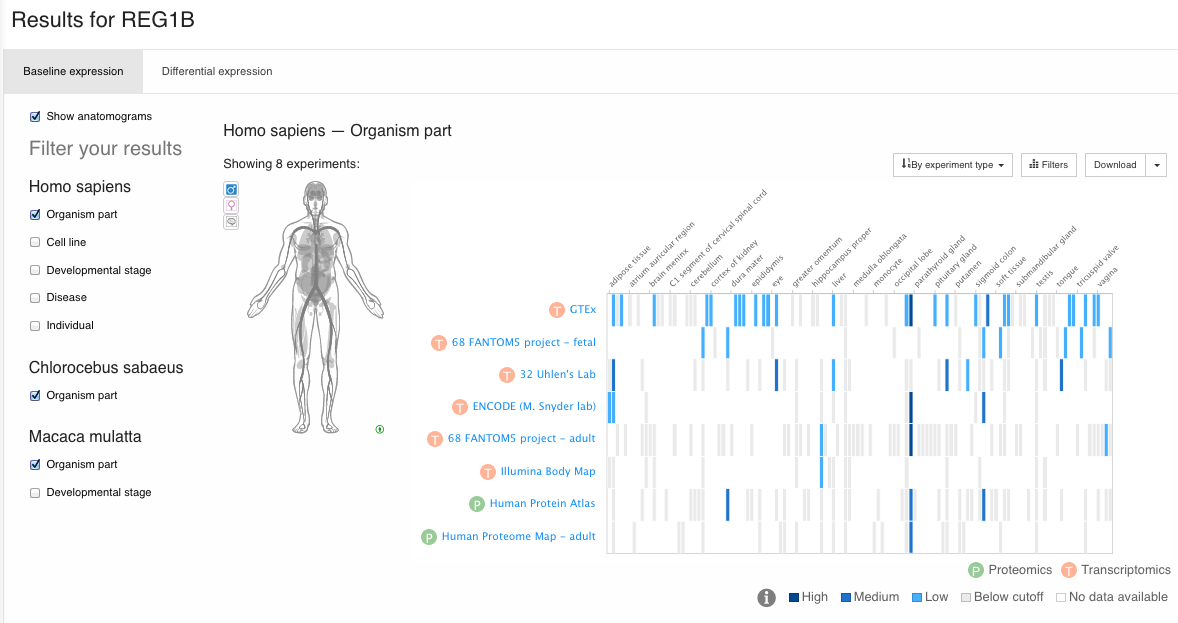
There you get information (when available) about:
- Projects in which the gene was assayed
- Tissues, cell lines, diseases in which the gene was assayed
- Expression level per gene and per transcript
- … and more.
EXERCISE
- From the main page, query gene SNAP25 for Homo sapiens.
- Select the Mammalian Kaessmann experiment.
- Show boxplot and transcripts view: in the “expression per transcript”: which transcript is more highly expressed in the prefrontal cortex?
- Go back to the first page of the search (SNAP25, Homo sapiens) and answer the same question for the 32 Uhlen’s lab experiment. Is the transcript boxplot not very readable? You can select the tissues to be displayed in “Organism parts” (bottom left) -> Select.