

Why to align protein and DNA sequences?
- To search sequences in the databases.
- To annotate (i.e., assign function to) genes, proteins, genomes by means of transferring curated annotation of homologous genes/proteins. For example, active sites of enzymes, binding sites of protein receptors, cis-regulatory elements in DNA are evolutionary conserved at the sequence level.
Pairwise sequence alignment methods
- Local alignment searches for the most similar regions in the two sequences. It can produce more than one alignment. It is best used for sequences that share some degree of similarity or of different lengths. Best suited for finding conserved elements.
- Global alignment compares two sequences along the entire length. It is therefore best for highly similar sequences of approximately the same length.
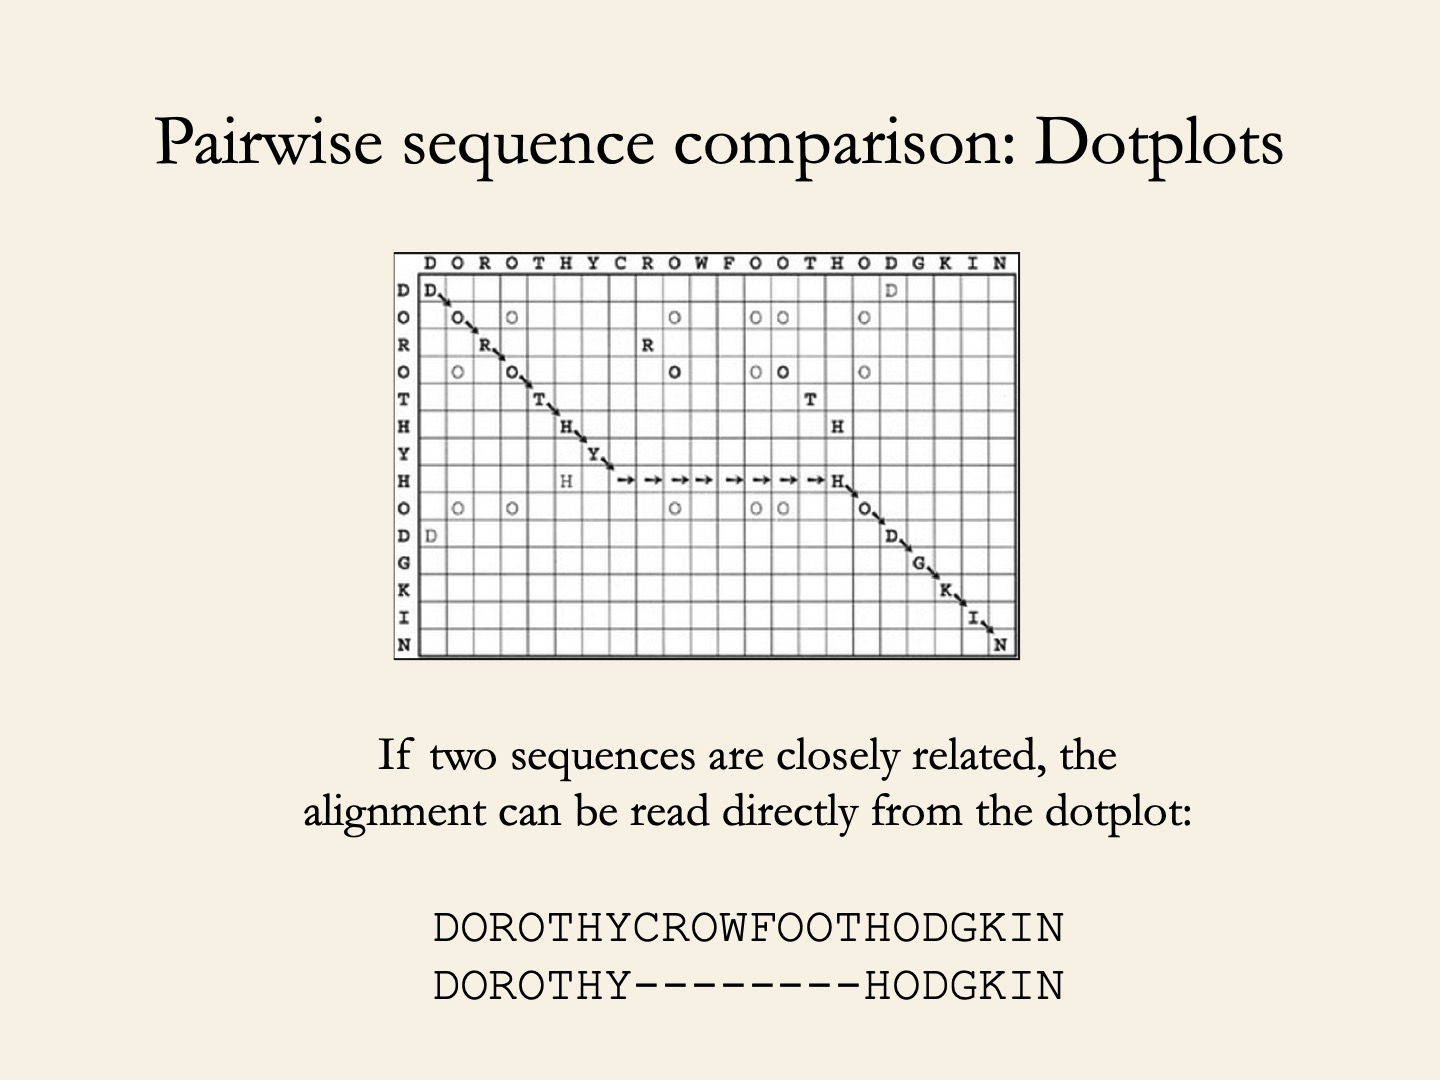
Local alignment: Dotplot
LALIGN - uses modified Smith-Waterman algorithm of 1981.
Let’s align two protein sequences:
ELISAVETAPUTHEREWHATEVERHWUDGKINS
ELISAVETAHWUDGKINS
- What is the identity / sequence similarity, of these two sequences?
- How is it calculated?
Interpretation of sequence identity for protein annotation: If two proteins share >25% of the sequence identity at 150 aa or >40% at 70 aa intervals they might be homologous.
Let’s look at Visual Output on the LALIGN result page that provides the dotplot of the alignment. How can we read it?
Let’s now align the following sequence against itself and look at Visual Output:
ELISAVETAHWUDGKINSELISAVETA
Repeat the same for the sequence with three repeats.
ELISAVETAHWUDGKINSELISAVETAELISAVETA
And finally, repeat the above for the following sequence.
ELISAVETAHWUDGKINSAAAAAAAAAAEMILIADARWINSSPSPSPSPSPSPSPSPPETERGALWANIST
Low-complexity region means a region of compositional bias; that is, a sequence composed of:
- homopolymeric runs (e.g., AAAAA),
- short-period repeats (e.g., SPSPSPSP), or
- over-represention of several residues.
Exercise:
- At UniProt, obtain the sequence of human Homeobox protein ESX1
ESX1_HUMANin the FASTA-format (TIP: search “fasta” on the UniProt webpage), align it against itself using LALIGN and look at the generated dotplot. - What can you tell about the sequence of this protein?
- What does UniProt tell about this sequence?
- What is known about the structure of this protein in Pfam? On the UniProt webpage for this protein, open a new window clicking on the link to Pfam (View protein in Pfam). (TIP: search “pfam” on the UniProt webpage.)
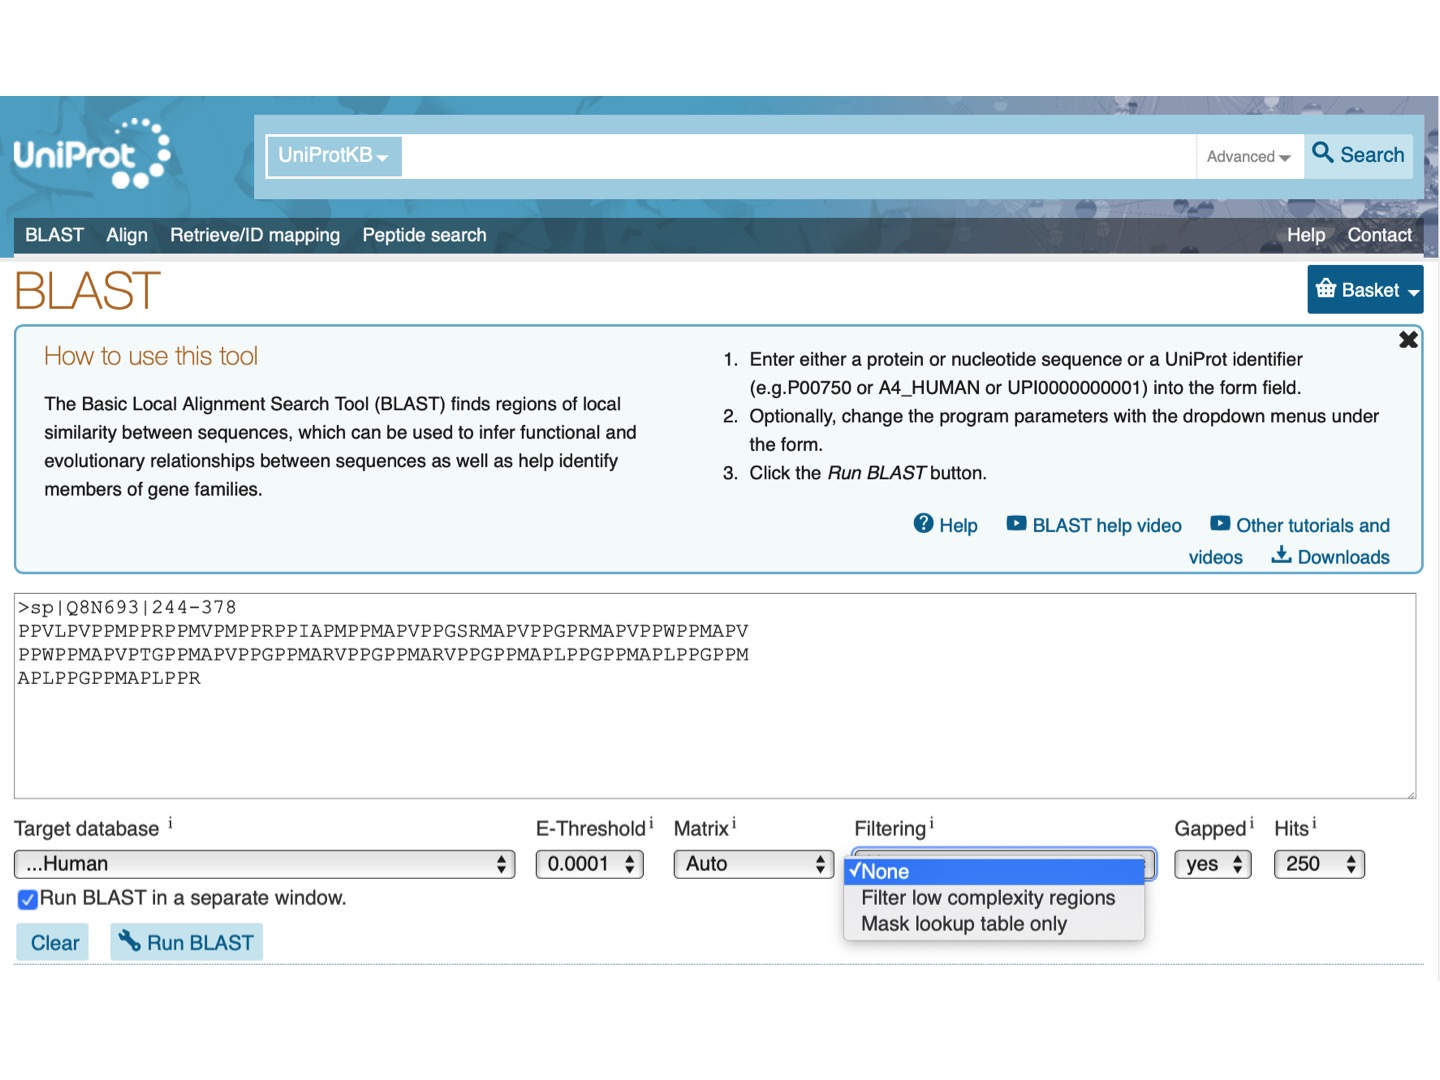
- Using right-click of the mouse, click to open a new tab while selecting BLAST button near the region of interest (positions 244 – 378). We want to see in how many human proteins similar sequence is present.
Since the BLAST is slow, let’s start run it now - We will be back to the results later on.
- Select Target database UniProtKB Human.
- Choose E-Threshold at 0.0001.
- Check the box Run BLAST in a separate window.
- Click the blue button Run BLAST.
- We leave “None” for Filtering because our sequence is low-compexity.
Local alignment: nucleotide BLAST
At NCBI BLAST website, select Nucleotide BLAST.
Further, check the box Align two or more sequences and check radio-button Program selection –> Optimize for somewhat similar sequences (blastn), and check the box below Show results in a new window.
Now let’s align these two nucleotide sequences.
tccCAGATATGTCAGGGGACACGAGcatgcagagac
aattgccgccgtcgttttcagCAGTTATGTCAGGGGACACGAGatc
We can see that the positions 4-25 of the first sequence are aligned with the positions 22-43 of the second sequence with 21 out of 22 aligned nucleotides being identical (identity 95%), with zero gaps.
The Blast score is equal 39. Let’s go back to the input page to see how the score is calculated. Expand Algorithm parameters.
You can see that the default scoring parameters are +2 for match and -3 for mismatch. As we have 21 matches and 1 mismatch the score is equal
39 = 2*21 - 3*1.
Now let’s introduce a gap in the second sequence.
tccCAGATATGTCAGGGGACACGAGcatgcagagac
aattgccgccgtcgttttcagCAGTTATGTCGGGGACACGAGatc
The score became 30 = 2*20 - 3*1 - 5*1 - 2*1, where -5 is a score for a gap opening and -2 for the gap of length 1.
Global alignment
At NCBI BLAST website, select Global Align and paste the above two sequences. You can see that the algorithm attempts to align two sequences along their entire length, thus giving the low sequence identity and many gaps.
Local alignment: protein BLAST
At NCBI BLAST website, select Protein BLAST. Further, check the box Align two or more sequences and check also the box below Show results in a new window.
Now let’s align the human and mouse major prion proteins typing their Accession numbers.
BAG32277
NP_001265185
The result:
Score = 381 bits(979) E-value = 4e-140 Identities = 226/255(89%) Gaps = 3/255(1%)
Now, let’s explore the default parameters of the method, clicking on the input page Algorithm parameters. You can see that except for the gap cost parameters all other parameters are different from those that Nucleotide BLAST uses.
Let’s first explore masking low-compexity regions. Check the box Low complexity regions.
NOTE: This filtering can eliminate statistically significant but biologically uninteresting reports from the blast output (e.g., hits against common acidic-, basic- or proline-rich regions), leaving the more biologically interesting regions of the query sequence available for specific matching against database sequences.
The result (three regions were masked):
Score = 256 bits(655) E-value = 5e-91 Identities = 181/238(76%) Gaps = 3/238(1%)
Important conclusion: When you report the results of the BLAST search, specify the parameters used for the search allowing the others to reproduce your result.
In contrast to the Nucleotide BLAST, the Protein BLAST calculates the score for matches and mismatches using the pre-defined matrices, PAM and BLOSUM.
PAM (Point Accepted Mutations) matrices (Dayhoff et al., 1978) depict amino acid substitution patterns in 70 groups of closely related (sequence identity > 85%) proteins.
- PAM1 corresponds to 1 aa change per 100 aa (1% divergence).
- PAM100 – 100 changes per 100 aa; made from PAM1.
- PAM250 – 250 changes per 100 aa; made from PAM1.
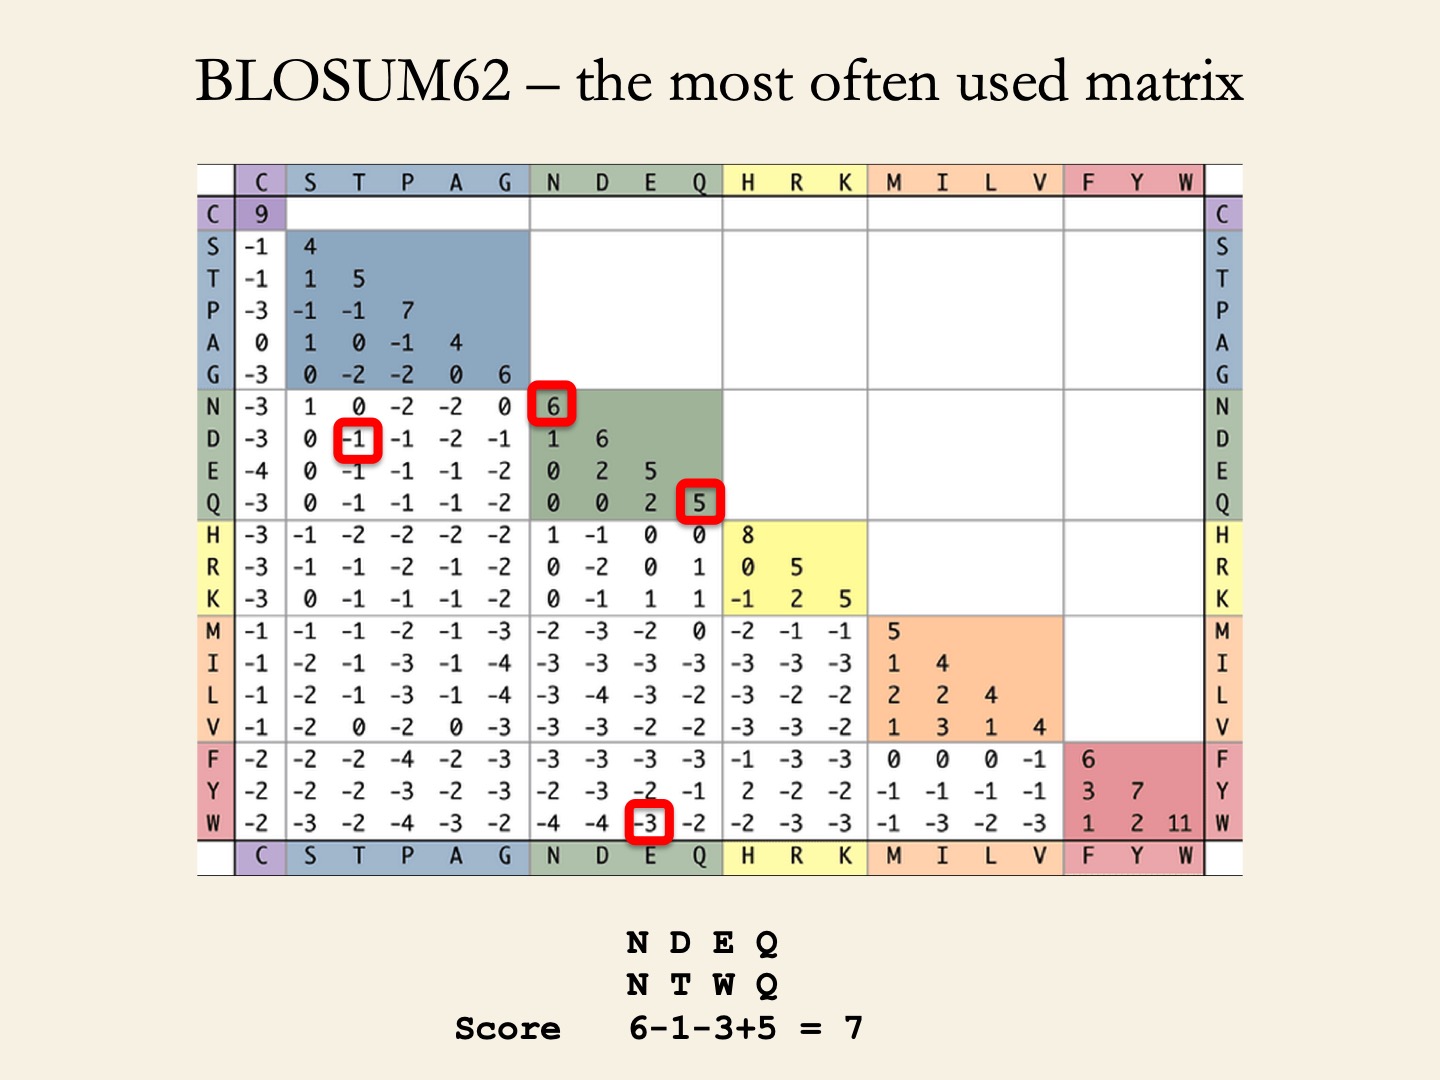
BLOSUM (BLOcks SUbstitution Matrices) matrices (Henikoff & Henikoff, 1992) depict amino acid substitution in 2,000 blocks (corresponding to structural or functional motifs) in 500 groups of related proteins.
- BLOSUM62 represent the conservation level of sequences used to derive the matrix (seq. identity >62%).
- BLOSUM90 ~ 90%.
- BLOSUM45 ~ 45%.
What matrices to use when?
- PAM30 and BLOSUM90 – For short highly significant alignments (above 70-90% sequence identity).
- BLOSUM62 – Detecting members of a protein family (above 50-60% sequence identity).
- PAM250 and BLOSUM45 – For longer alignments of divergent sequences (below 50% sequence identity).
What is that misterious Expect value, or E-value?
- E-value of the alignment is the expected number of sequences that give the same
Z-scoreor better if the database is probed with a random sequence. For example, an E-value of 1 assigned to a hit can be interpreted as meaning that in a database of the current size one might expect to see 1 match with a similar score simply by chance. Z-scoreof thescore Sof the alignment is calculated as(S – mean score over database)/SD.- E-value is not the probability!* If
Pis the probability to obtain by chance an alignment with the sameZ-scoreor better, then P and E (E-value) are related asP = 1- e^(-E). - E-value depends on the size of the database and it ranges from 0 to the number of sequences in the databases.
- The default E-value used by NCBI BLAST is 10.
- The lower the E-value, or the closer it is to zero, the more “significant” the match is.
BLAST search against NCBI, UniProt, PDB and many other databases (that implement BLAST algorithm)
Protein structural domain is a compact unit of a 3D protein structure folded (presumably) independently in solution; it does not necessarily carry specific function.
Protein functional domain (described in such databases as Pfam, PRINTS, NCBI CDD, COGs, etc.) is evolutionary conserved protein region; not necessarily coincides with structural domain.
The suggested cut-offs to infer biologically significant similarity using BLAST:
- For proteins, to predict protein domain 3D structure, use blastp against Protein Data Bank proteins (PDB database): sequence identity > 25% (for protein domains longer 100 aa), E-value < 1e-4.
- For proteins, to predict protein domain function in absence of structural information, use blastp against annotated proteins (UniProtKB/SwissProt database: sequence identity > 40% (for protein domains longer 100 aa) or higher , depending on function (e.g., 70-80% for enzymes), E-value < 1e-4.
- For proteins, to identify the protein domain family, use blastp against non-redundant protein sequences (nr): : sequence identity > 25% (for protein domains longer 100 aa), E-value < 1e-4.
- For nucleotides: sequence identity >= 70% (for the sequence of more than 300 nt), E-value < 1e-6.
Exercise:
Let’s now go back to the results of the protein BLAST for the region 244 - 378 of the human Homeobox protein ESX1 ESX1_HUMAN.
Following the suggested cut-offs (above), we have chosen the E-value < 0.0001, and searched the sequence of the 244-378 region against UniProtKB Human database, because our goal is to investigate if this region, which is 15 X 9 AA tandem repeats of sequence pattern P-P-x-x-P-x-P-P-x, is present in other human proteins.
Click on the top left panel Reviewed proteins. We can see that this repeat is present in at least 211 curated human proteins.
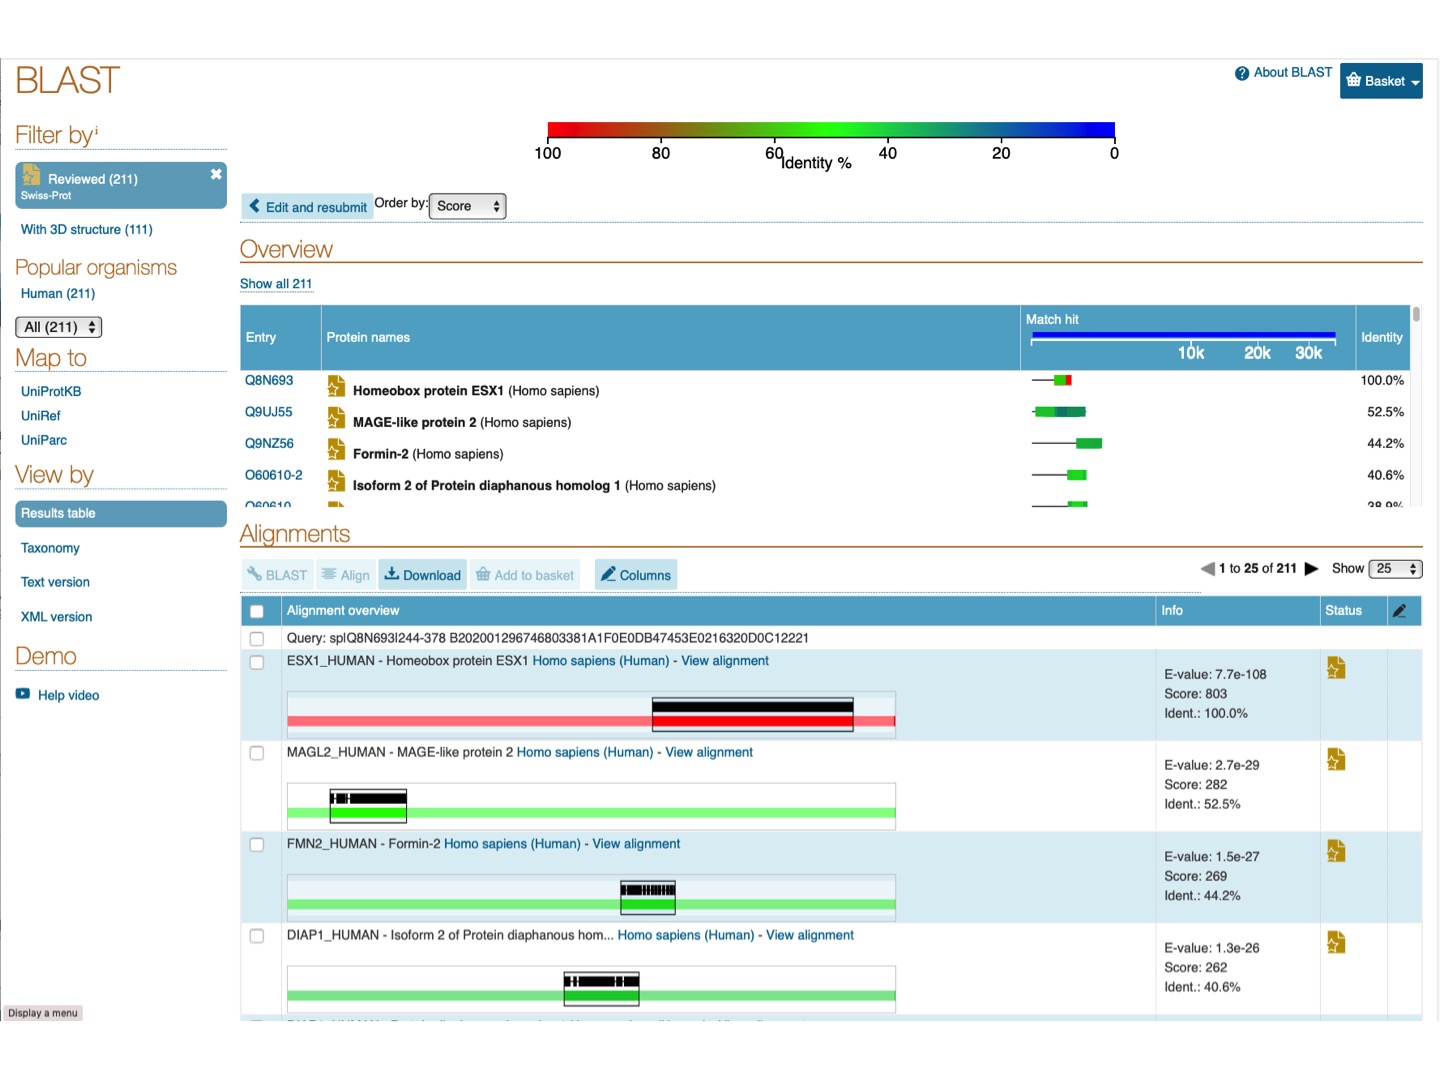
Now, we can look at a specific alignment.
For example, click on View alignment for FMN2_HUMAN - Formin-2 Homo sapiens (Human).
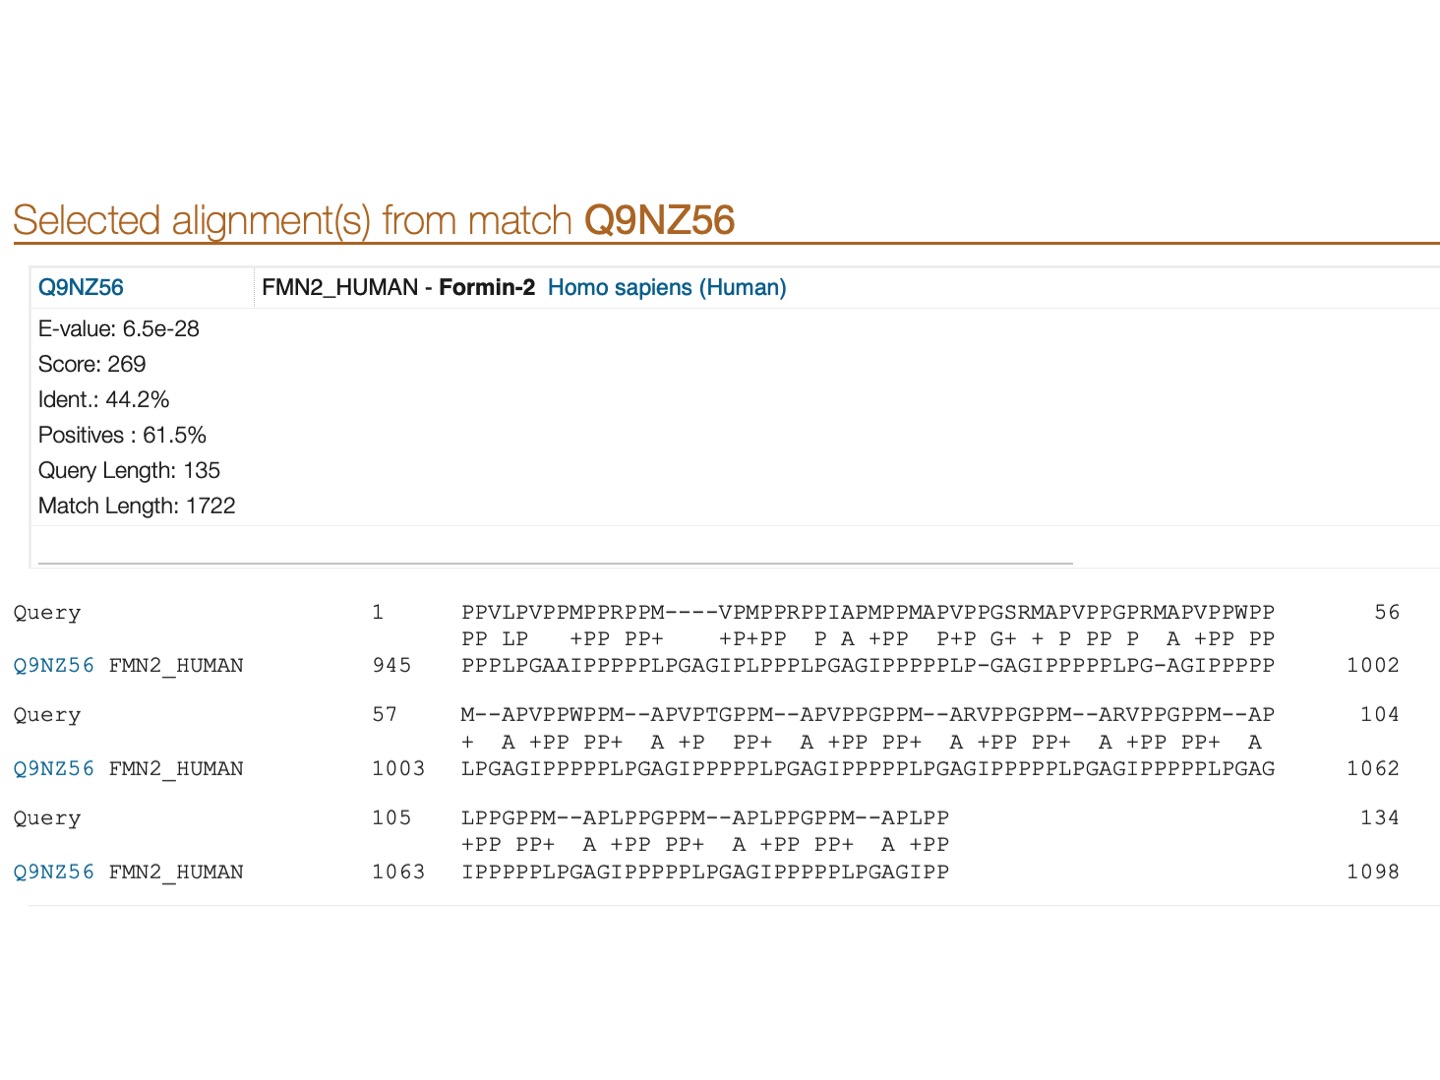
We can see that the region we study is aligned with the 945 - 1098 region of the formin-2 protein.
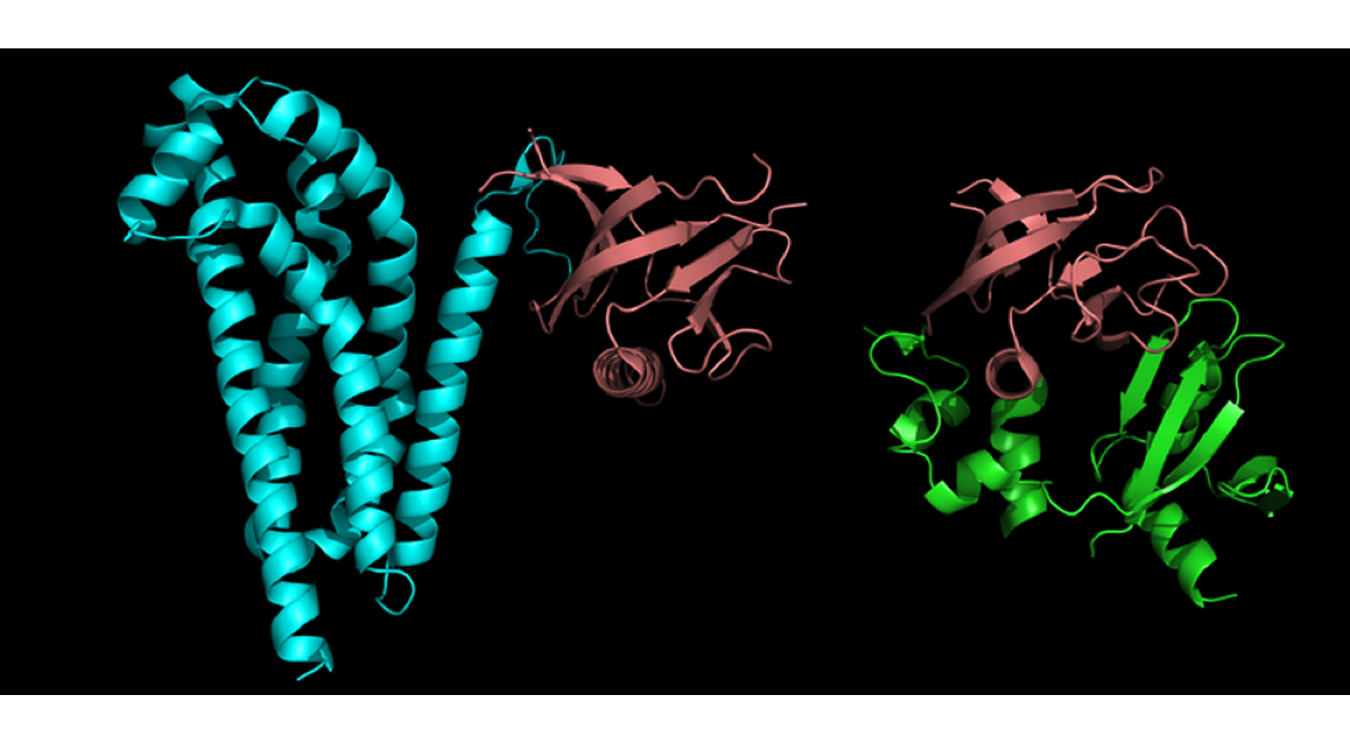
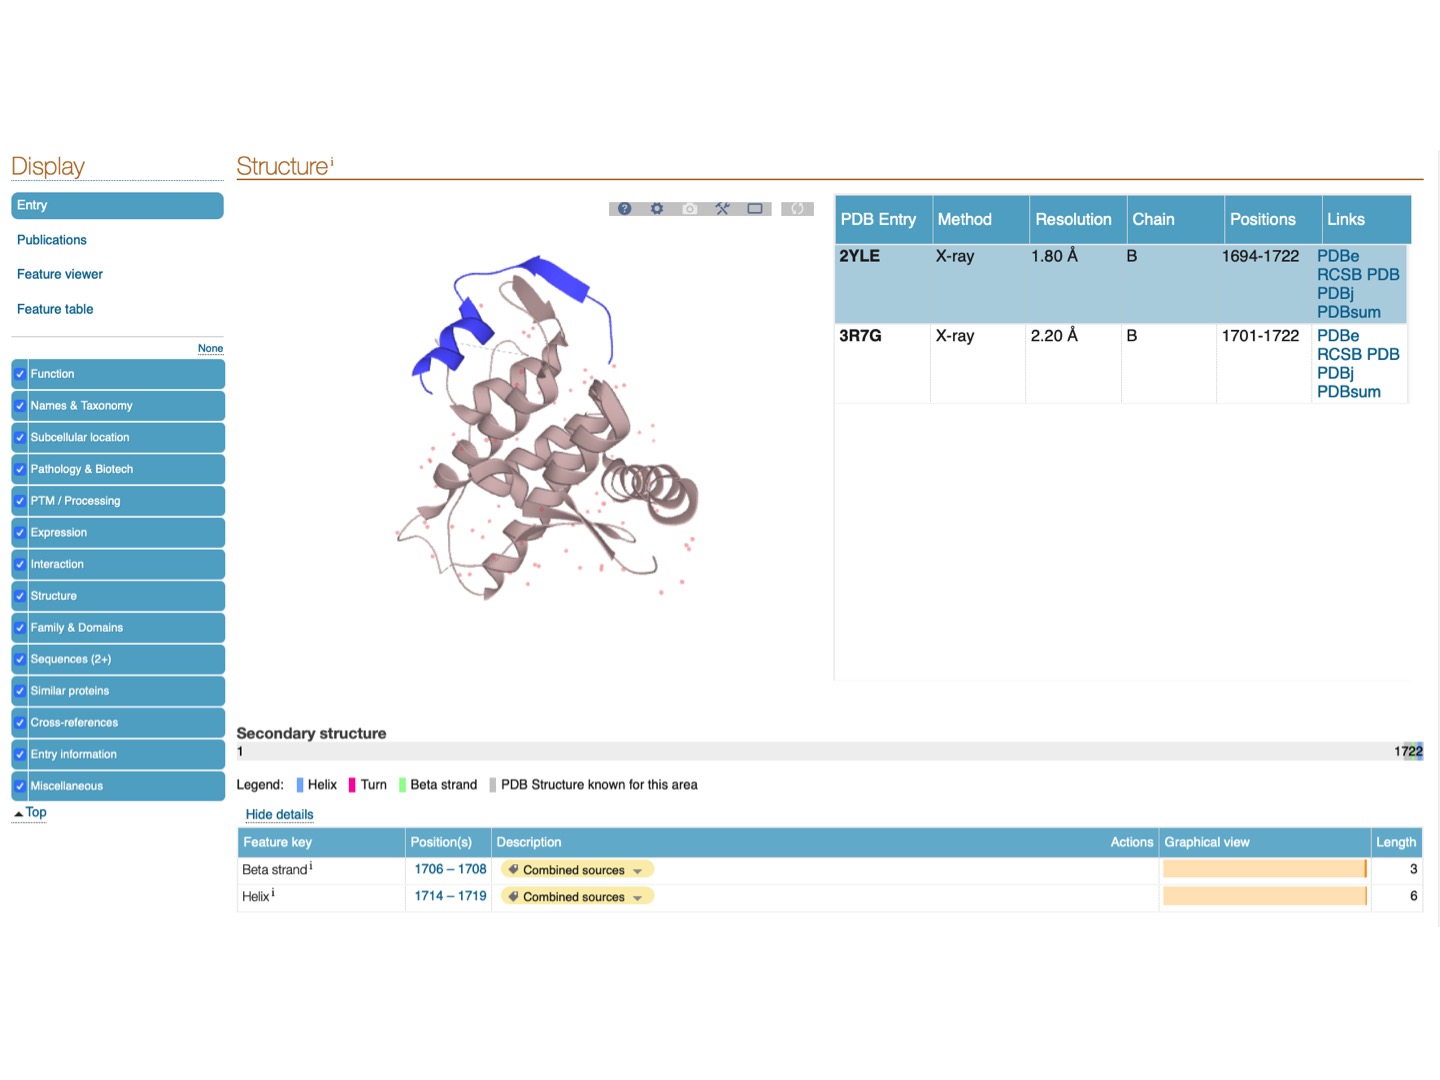
Click on the link to the formin-2 protein Q9NZ56 and navigate to Structure.
We can see that this region is not present in the X-ray structure solved for this structure (because it is disordered). This region is also part of the much larger FH1 domain.
You can look at other alignments to investigate this sequence further and see, for example, that it is aligned with the positions 469-637 of SF01_HUMAN - Splicing factor 1 Homo sapiens (Human) which are part of the Proline-rich domain of low-complexity.
You can also search the Protein Data Bank, which contains all solved 3D structures of proteins. If you do so, make sure to use Advanced sequence search and avoid masking low-complexity regions, which PDB is doing by default for their implementation of the protein BLAST.
Multiple sequence alignment
“pairwise alignments whispers… multiple alignment shouts out loud” (Hubbard et al., 1996)
Multiple sequence alignment is used to:
- Find structural similarity in proteins and RNA.
- Predict secondary structure and model a protein 3D structure.
- Build phylogenetic trees.
- Annotate a protein sequence to a family or a domain.
- Build a profile for a new family.
- Identify functional motif in DNA or protein.
Popular methods:
- Clustal Omega - implemented on the UniProt website.
- T-Coffee (developed by Cedric Notredame, CRG).
- MUSCLE
- MUFFT
Multiple protein alignment as implemented in UniProt
At UniProt, let’s search for Il1a protein.
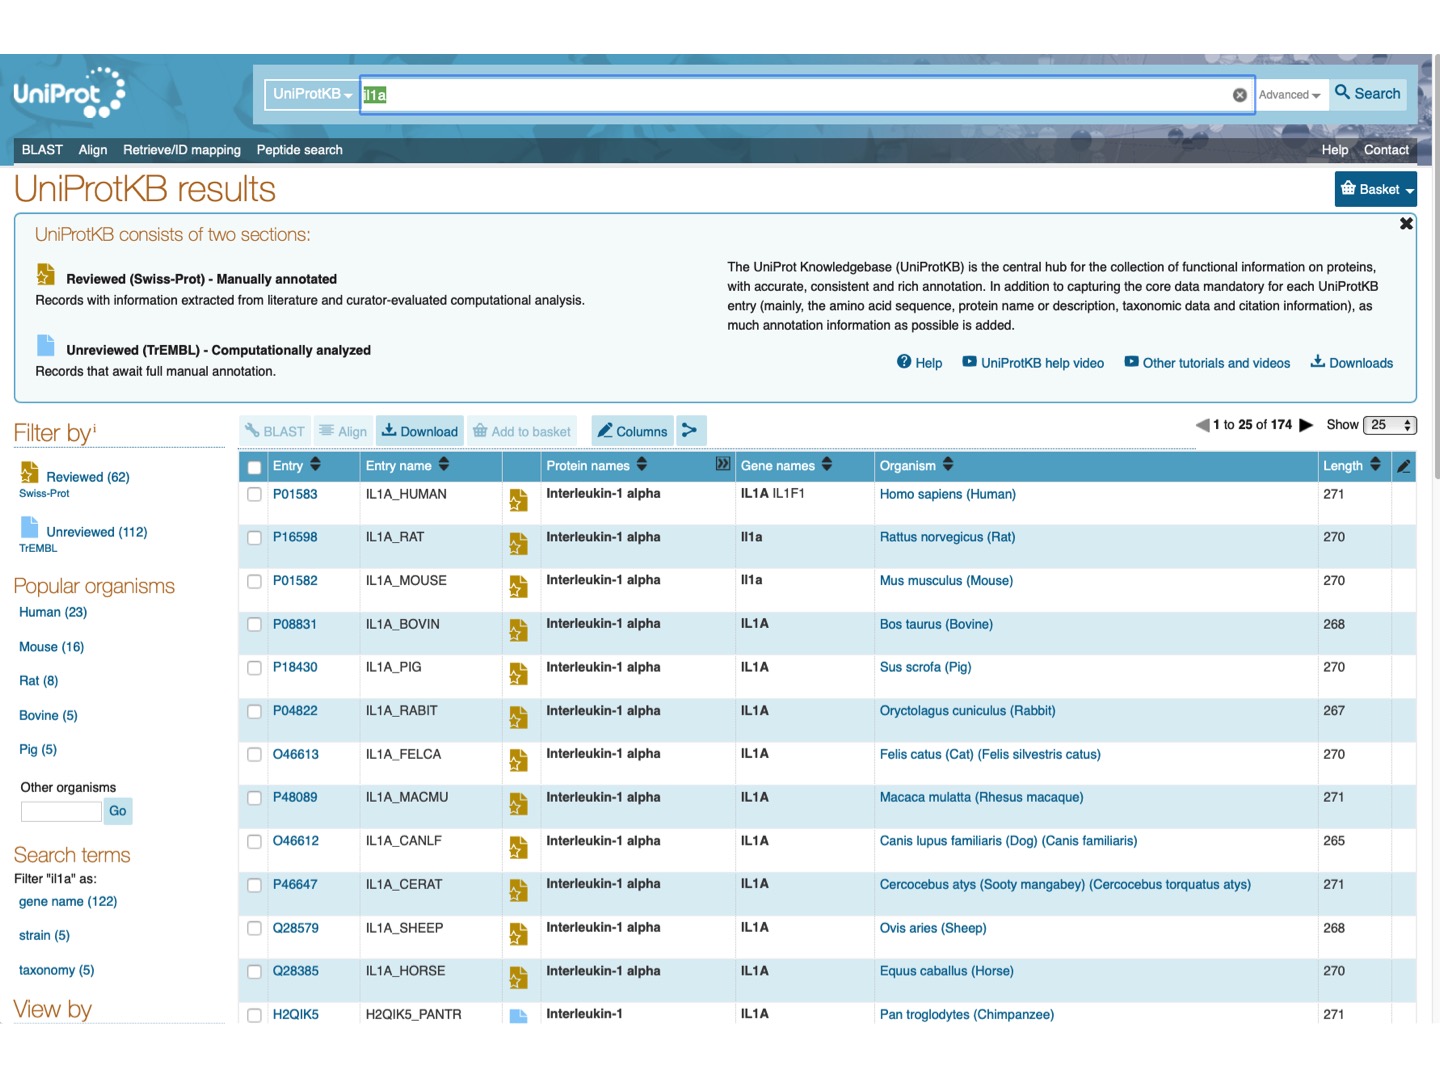
Select Filter by Reviewed and check Il1a protein for a few mammalian species (any 6-15). Click Align on the upper tab.
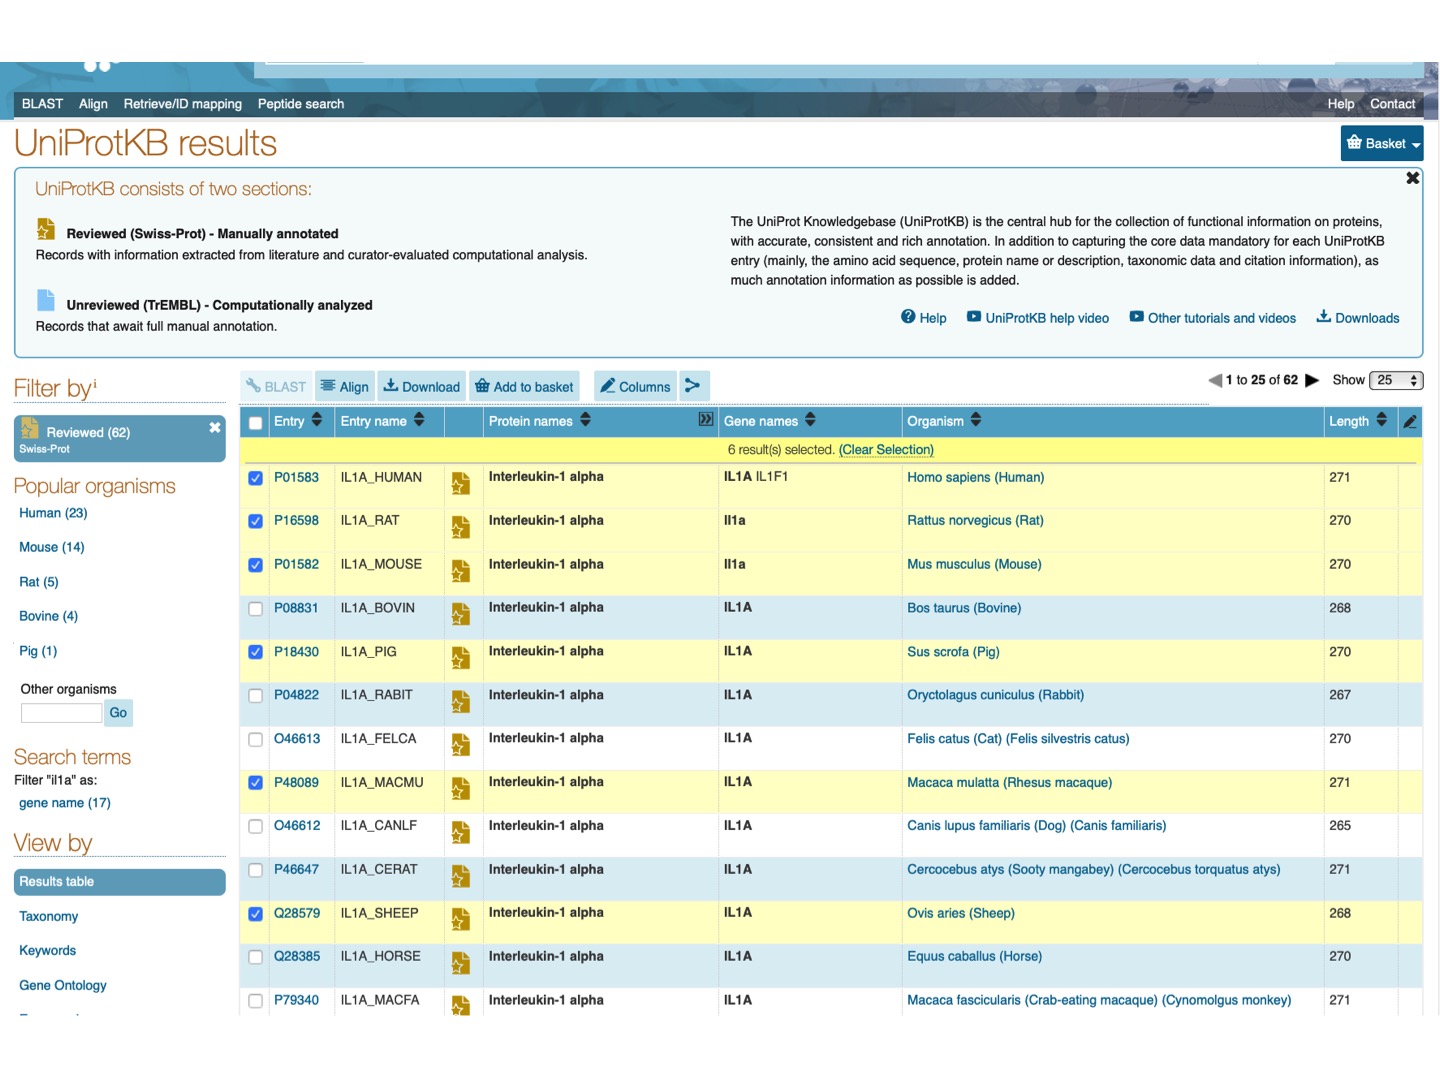
Here is the resulting alignment. You can scroll down or click on the upper left panel to see the phylogenetic tree for the selected species.
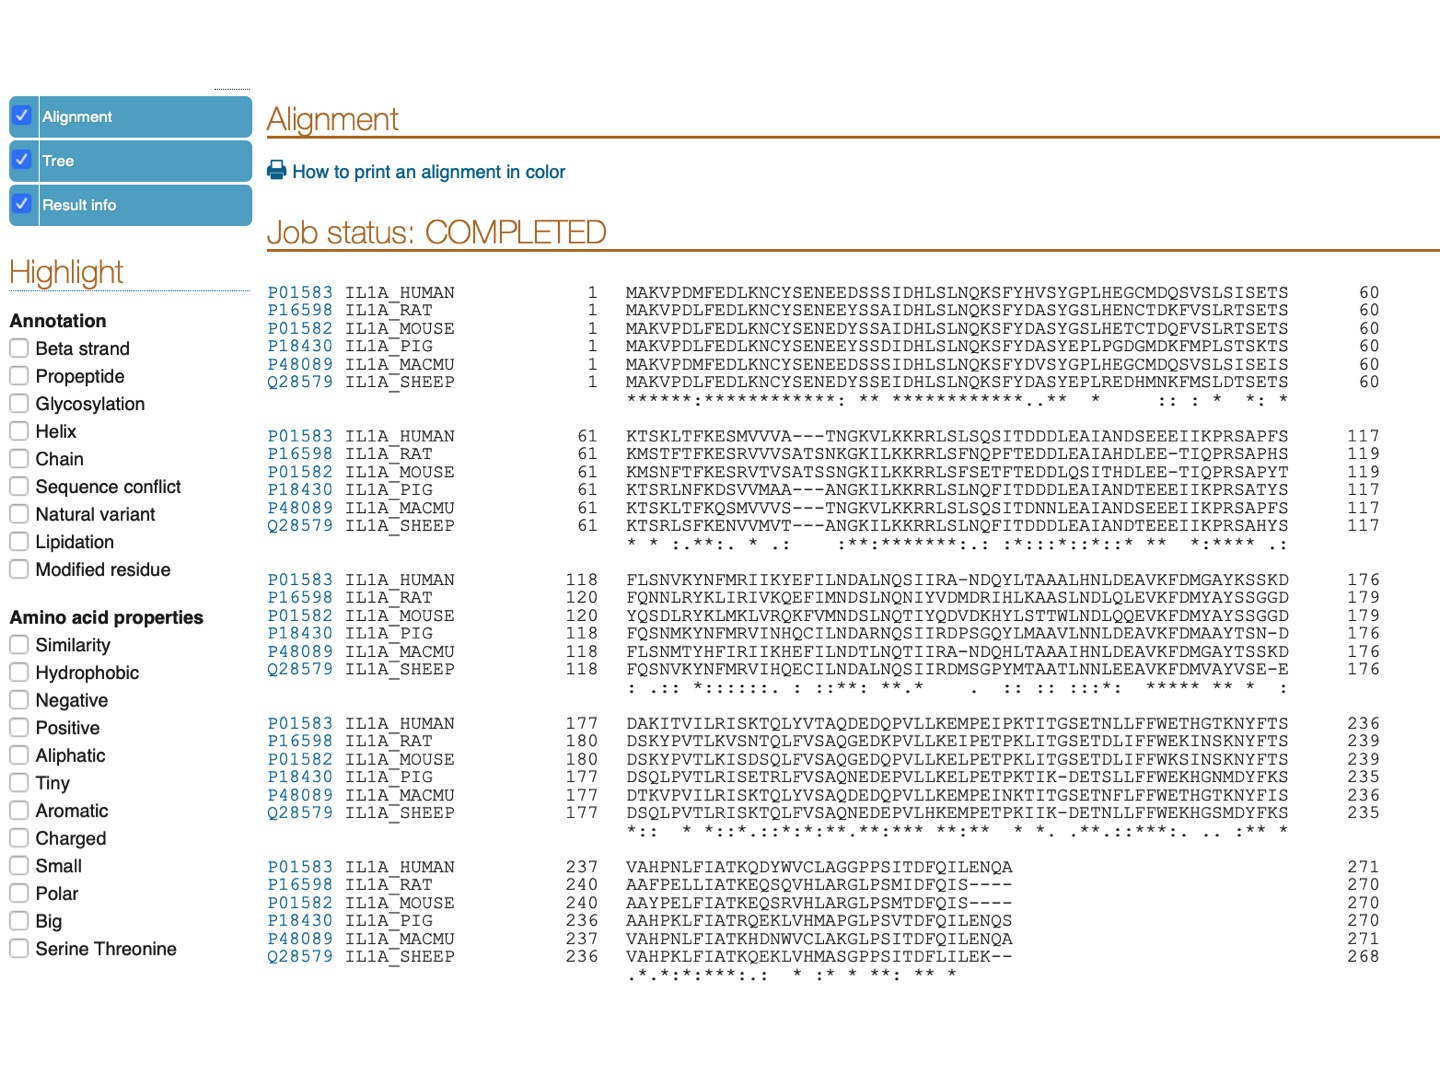
Pro-peptide of IL-1α has a functional nucleus localization signal (NLS) with a sequence
LKKRRLS
Can you find this signal and tell if it is conserved in the aligned proteins? (TIP: highlight positive & charged amino acids, as K (Lysine) and R (Arginine) are both positively charged amino acids.)