Genome Browser
Read alignments (in the BAM, CRAM or BigWig formats) can be displayed in a genome browser, which is a program allowing users to browse, search, retrieve and analyze genomic sequences and annotation data using a graphical interface.
There are two kinds of genome browsers:
- Web-based genome browsers:
- Desktop applications (some can also be used for generatig a web-based genome browser):
Small size data can be directly uploaded to the genome browser, while large files are normally placed on a web-server that is accessible to the browser. To explore BAM and CRAM files produced by the STAR mapper, we first need to sort and index the files. In our case, sorting has been already done by STAR because we output alignments to the BAM files sorted by coordinates. The indexing step:
$RUN samtools index alignments/A549_0_1Aligned.sortedByCoord.out.bam
$RUN samtools index alignments/A549_0_1.cram

ls alignments

A549_0_1Aligned.sortedByCoord.out.bam      A549_0_1.cram.crai     A549_0_1Log.progress.out      A549_0_1_STARtmp
A549_0_1Aligned.sortedByCoord.out.bam.bai  A549_0_1Log.final.out  A549_0_1ReadsPerGene.out.tab  salmon_A549_0_1
A549_0_1.cram                              A549_0_1Log.out        A549_0_1SJ.out.tab
UCSC Genome Browser
IMPORTANT! Be careful with the chromosome name conventions since different genome browsers name chromosomes differently. Thus UCSC names chromosomes chr1, chr2,…chrM; while Ensembl, 1, 2, … MT. When you map reads to a genome with a given convention you cannot directly display BAM/CRAM files in the genome browser that uses a different convention. GENCODE, from which we downloaded a human genome, uses the UCSC convention, we therefore can directly display our BAM/CRAM files in the UCSC Genome Browser.
First, you need to upload your sorted bam (or cram) file(s) together with an index (.bai or .crai) file(s) to a http server that is accessible from the Internet. We already made our files accessible at this address:
https://public-docs.crg.es/biocore/projects/training/RNAseq_2019/
Using the mouse’s right click copy this URL address.
Now go to the UCSC genome browser website.
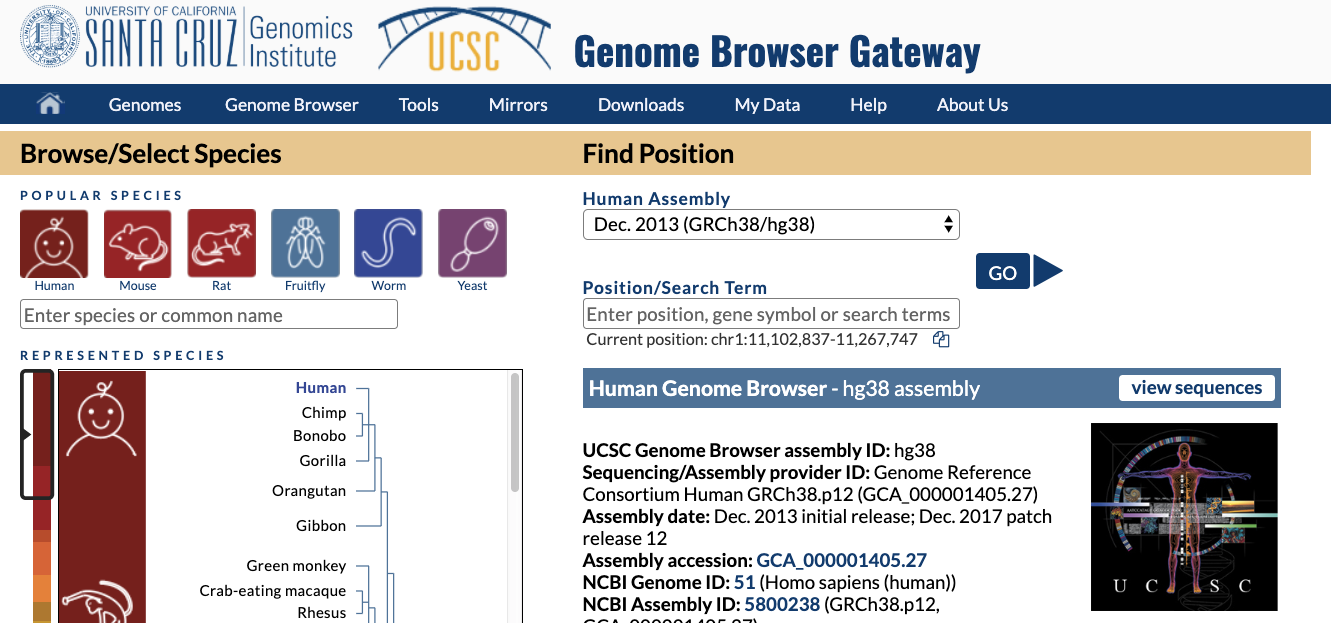
Choose human genome version hg38 (that corresponds to the GENCODE annotation we used). Click GO.
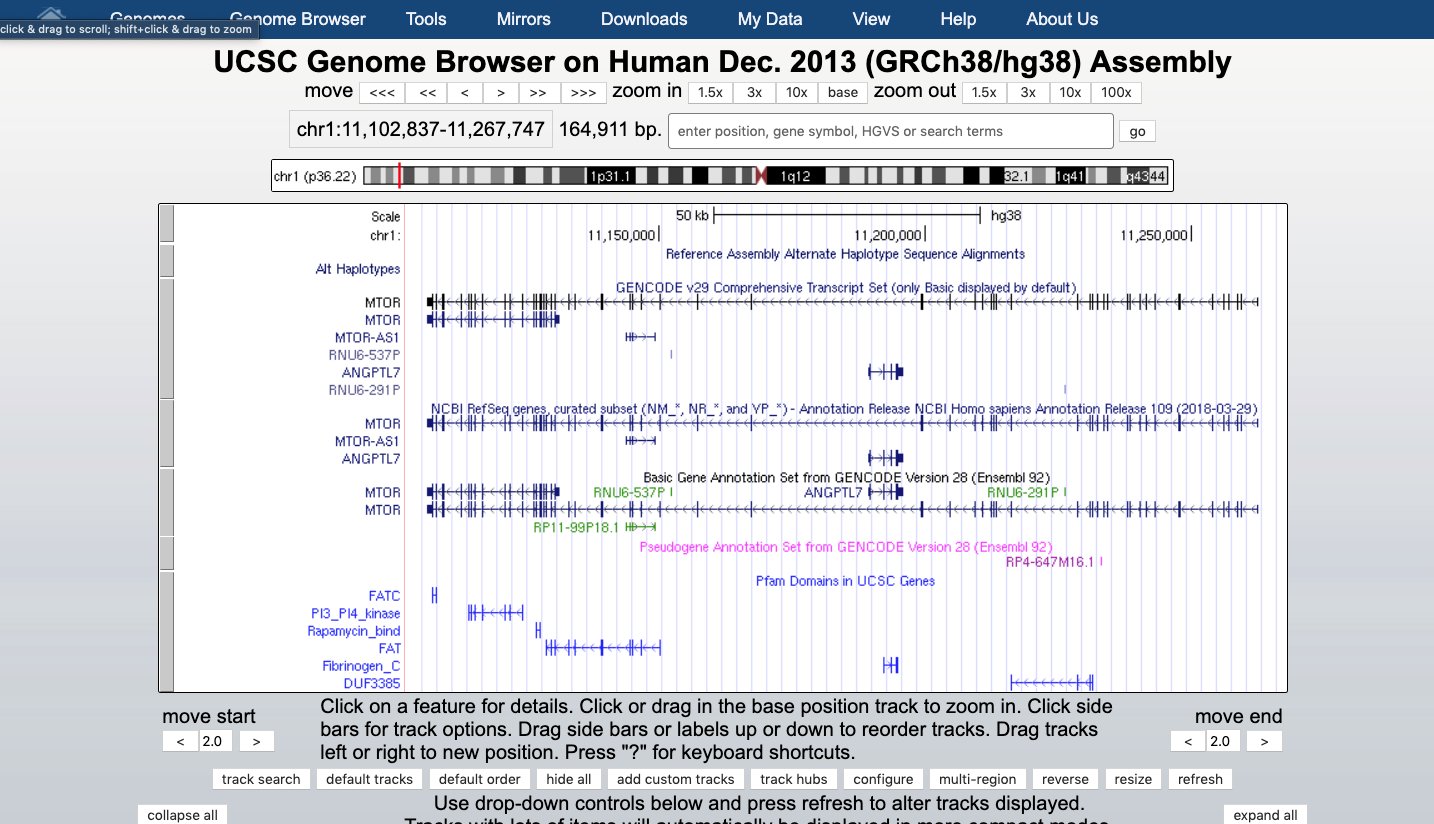
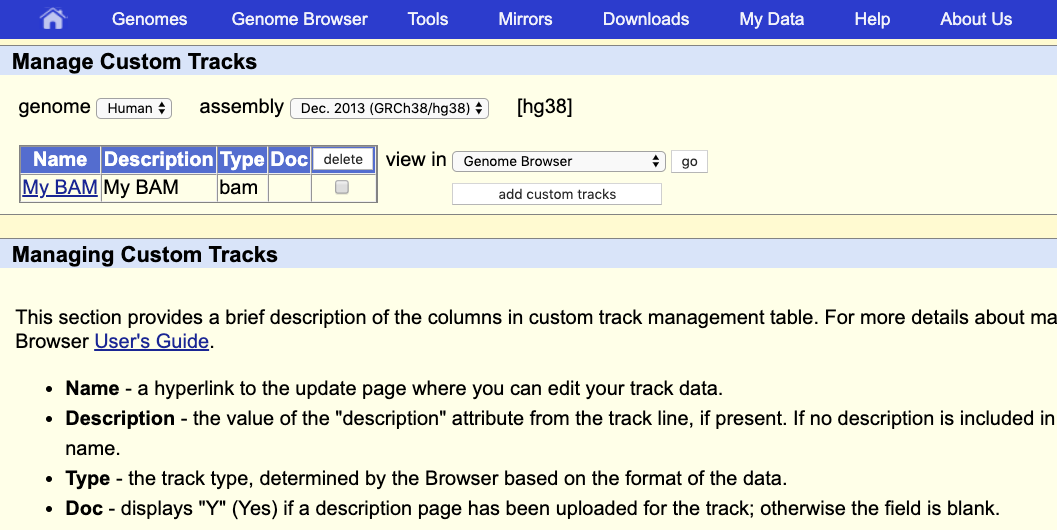
At the bottom of the image click ADD CUSTOM TRACK
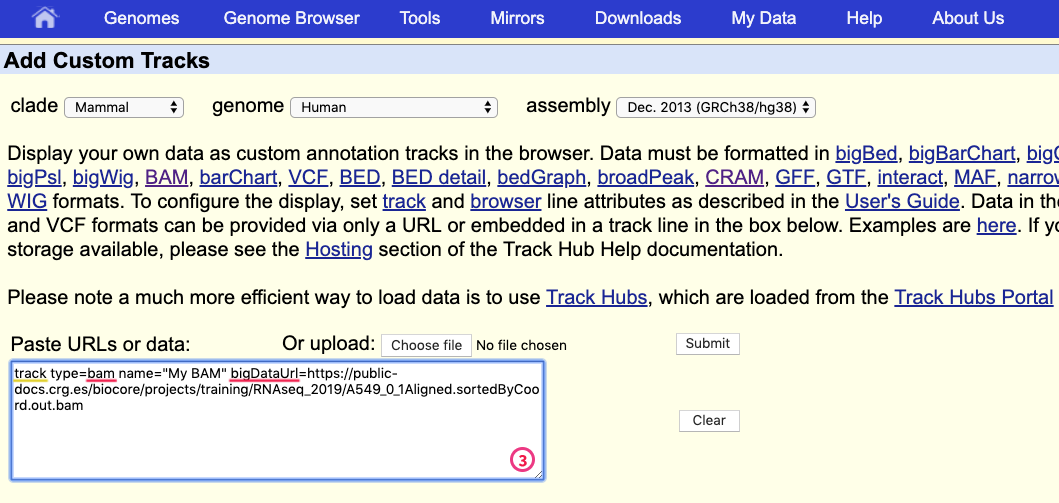
and provide information describing the data to be displayed:
- track type indicates the kind of file: bam (same is used for uploading .cram)
- name of the track
- bigDataUrl the URL where the BAM or CRAM file is located
track type=bam name="My BAM" bigDataUrl=https://public-docs.crg.es/biocore/projects/training/RNAseq_2019/A549_0_1Aligned.sortedByCoord.out.bam
Click “Submit”.
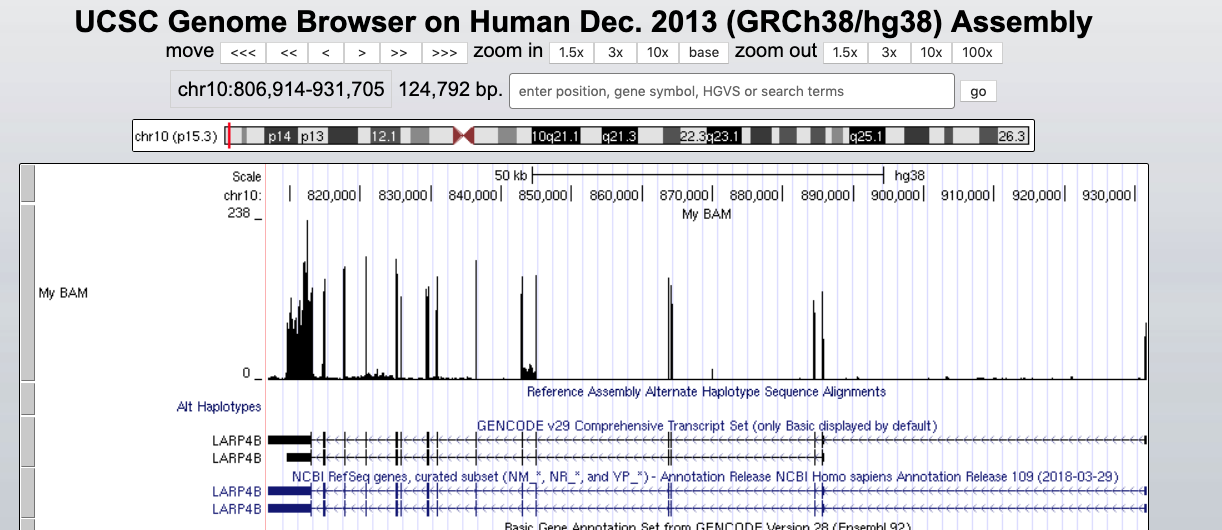
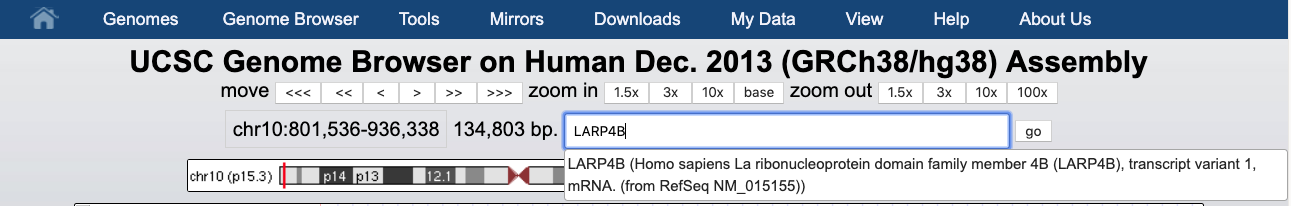
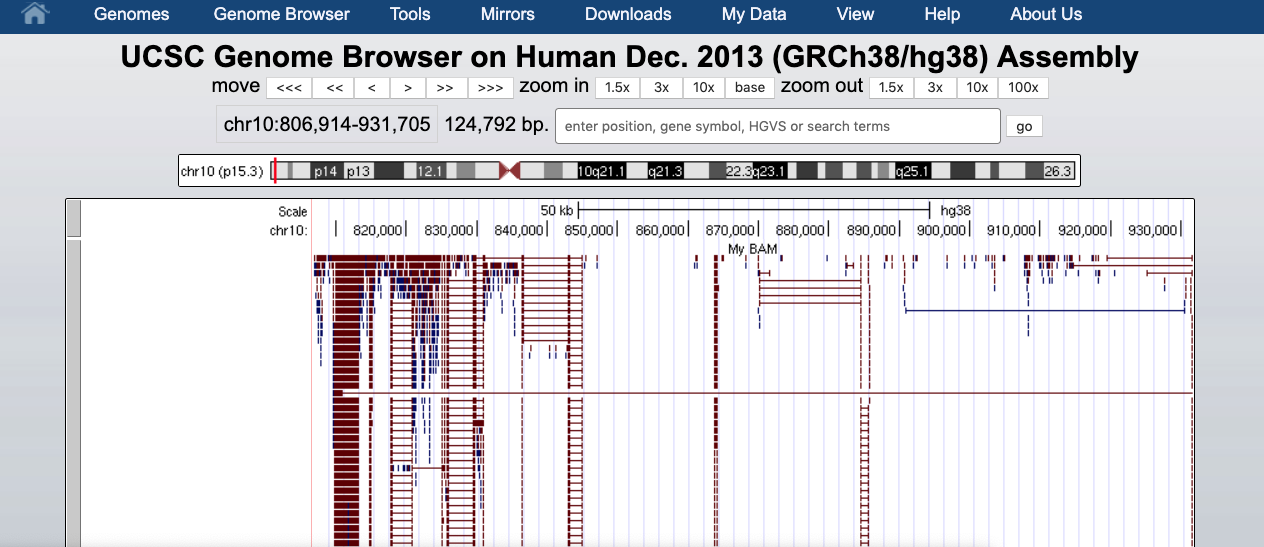
This indicates that everything went ok and we can now display the data. Since our data are restricted to chromosome 10 we have to display that chromosome. For example, let’s select the gene LARP4B.
And we can display it.
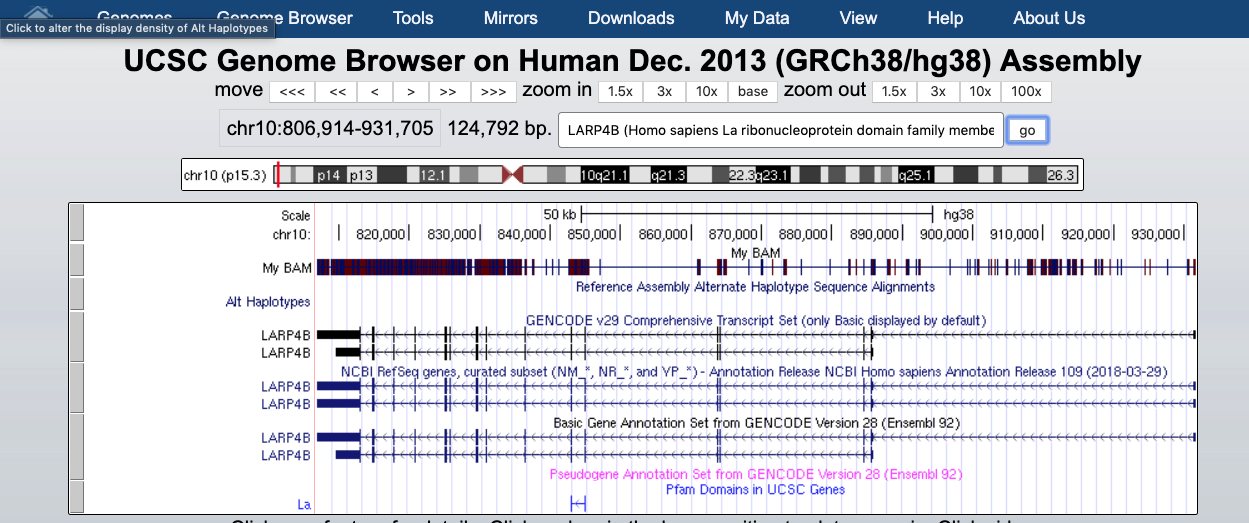
The default view can be changed by clicking on the grey bar on the left of the “My BAM” track. You can open a window with different settings; for example, you can change the Display mode to Squish.
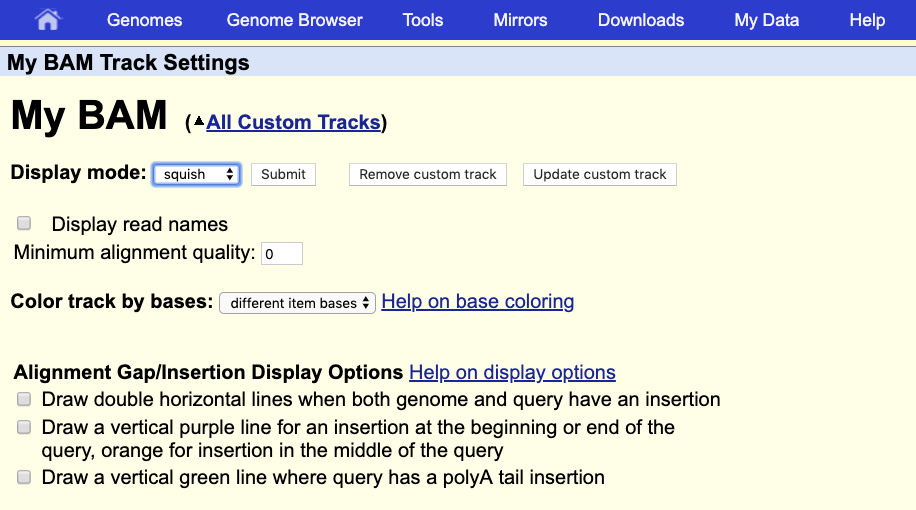
This will change how data are displayed. We can now see single reads aligned to the forward and reverse DNA strands (blue is to +strand and red, to -strand). You can also see that many reads are broken; that is, they are mapped to splice junctions.
We can also display only the coverage by selecting in “My BAM Track Settings” Display data as a density graph and Display mode: full.
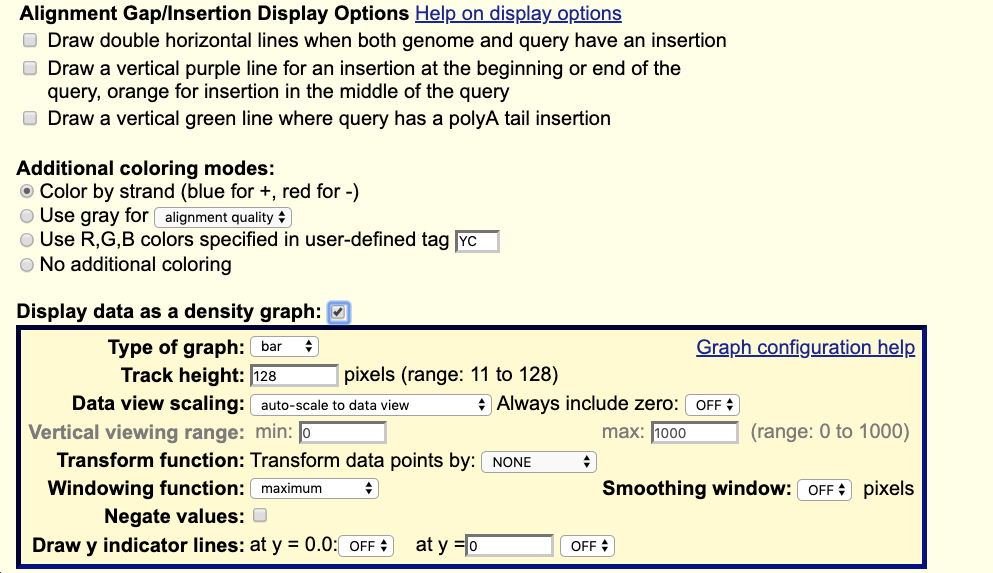
These expression signal plots can be helpful for comparing different samples (in this case, make sure to set comparable scales on the Y-axes).