

Genome browsers
Genomic information is stored in public databases that can be accessed by the whole scientific community. We already mentioned that some of them also host web applications able to display the data in a graphical way also known as Genome Browsers, such as:
- NCBI Genome Browser (which we already interacted with)
- ENSEMBL Genome Browser
- UCSC genome browser
UCSC Genome Browser
Let’s open the UCSC Genome Browse and search for GAPDH gene in human genome (assembly GRCh38/hg38 - Dec. 2013; this is the most recent available assembly). Specifying the assembly is important since every annotation is likely to have different coordinates among different version of the genome assembly.
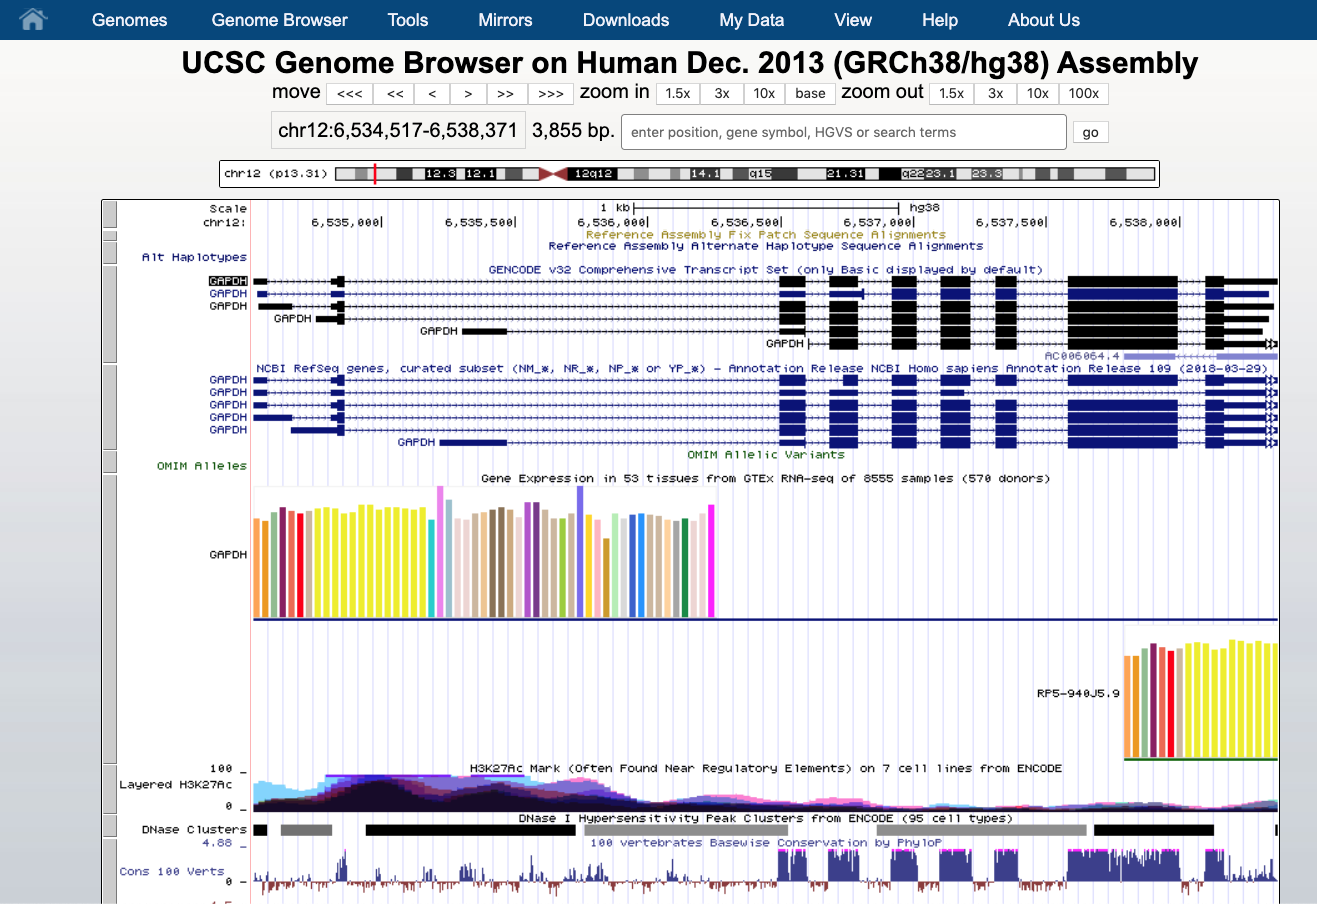
We see that the GAPDH gene is located on the chromosome 12 (chr12), that is shown on the top as a grey box, at the positions 6,534,517 - 6,538,371. The gene is displayed as a number of boxes (exons) and “arrows” (introns). The arrow direction indicates the gene strand, in this case it lies on the plus strand (5’ -> 3’).
Below the transcripts there are a number of annotations that can be hidden or shown. They are all listed below the graph.
In this picture, that is likely different from what you see, we have the gene annotation from Gencode and NCBI, the gene expression in different tissues from GTEx project.
Every row is a type of annotation. Here we have:
- GENCODE gene annotation
- NCBI / RefSeq gene annotation
- OMIM allelic variants
- GTEx gene expression
- H3K27Ac histone marks and DNASe clusters from ENCODE
- Conservation among 100 vertebrates
- Common SNPs
- Presence of different families of repeats (Sine, Line etc).
You can click on each row for accessing sub-menus for hiding, showing more, customizing. Below the browser there are different categories of annotations that can be turned on or off depending on the user preference.
Hovering the mouse over the display we can see the numbering for each of 9 exons. You can use the left click on the top (where the coordinates numbers are) for selecting a portion of the genome to be either highlighted or zoomed. When you zoom in enough you can start seen some hidden features, such as nucleotides.
Demo #1
A) Let have a look at the different exons. We can select using the mouse for highlightin and - or zooming. We see different isoforms. We can zoom and get the coordinates of each exon. Zooming more will reveal more features up to sequences. Let’s have a look at the codons in the exons, we see that they have different colors. B) Let’s see below the conservation among other species. We can see that in some cases there is no alignment or there is a gap. In closest species there are only small variations. We can also check for variations in the human population by looking at the annotation in the section variation. There are a number of database to be checked and displaid. You can then inspect also the information of variations associated to cancer by using for instance the TCGA Pan-cancer annotation. C) You can use information about the gene jsut by clicking on it. This will open a page with quite a lot of information such as expression in different tissues, secondary structures of UTRs, pathways etc. D) Epigenetics. You can turn on several annotations related to the regulations like the Regulation from ENCODE that contains several tracks with the results of ChIPseq experiments in different cell lines. This can be useful to understand if there is some transcription factor binding our protein and if they can be involved in the regulation of the expression.
You can also add your custom data in different formats by clicking on add custom tracks. As an example you can copy paste the following intervals in BED format:
chr12	6534517	6534717
chr12	6535800	6536000
chr12	6538171	6538371
now they are displayed as black box on the top of the browser. In this way you can display results of your experiments like the ones from a ChIPseq.
Exercise #1
A) Let zoom in to see the sequence of the 9th exon (use the right mouse to do the selection).
- What are the genome positions of the longest version of this exon?
- If you zoom in, can you understand what different black, gray, green and red boxes designate?
- What does the first letter W in the exon mean?
B) Let’s investigate the GAPDH gene a bit more.
- Which species shown by default have different amino acid sequence from a human one corresponding to 10 codons of exon 2?
- For which species there is a gap in the alignment? Which have no alignment shown?
- How many Common SNPs (version 151) does exon 2 contain (expand to the full view information on SNPs using left mouse hovering it over the left bar)?
- At which positions are these SNPs located (click on the feature)?
- Add the track “TCGA Pan-cancer” from the “Phenotype and Reference” collection of tracks. How many cancer-associated variants are observed in exon 7?
C) Looking at the gene features:
- According to the GTEx data, in which tissues this gene is expressed the most?
- How many orthologous for this gene are shown?
- With how many KEGG pathways this gene is associated? If you click on the first pathway, can you tell what product and substrate are used by this enzyme?
D) Looking at epigenetical data:
- Go to the ENCODE Regulation Tracks and turn on the TF ChIP. Now look at the transcriptional start site of the gene. How many transcription factor are binding exon 1?
- Change the ChIP-seq peak score range to 500-1000 to filter out the low quality peaks. How many ChIP-seq peaks are shown now?
Ensembl Genome Browser
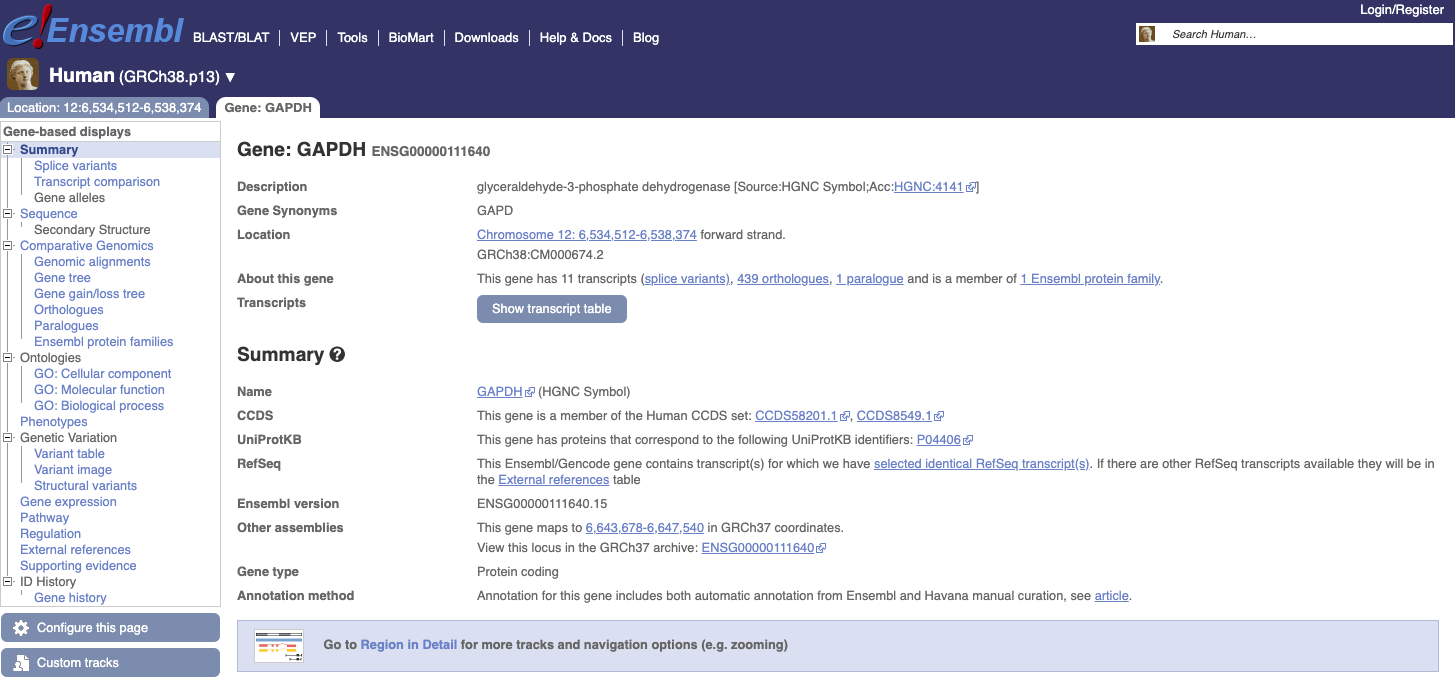
Now let’s move to another Genome Browser by clicking this link. Let’s search the same gene: GAPDH. You see several results and the “best gene match”. Clicking on it, we will see a new page with information about the gene and below the browser itself.
 |
 |
The page is composed of two tabs:
- Location with coordinates. Information on the genomic context, comparative genomics, genetic variation, markers, link to other genomes (and old version of the human genome).
- Gene:
Information about the gene itself, transcript table, summary, protein products etc.
A nice help is given clicking on the question mark “?”, while if you click on region detail you are directed on the proper genome browser.
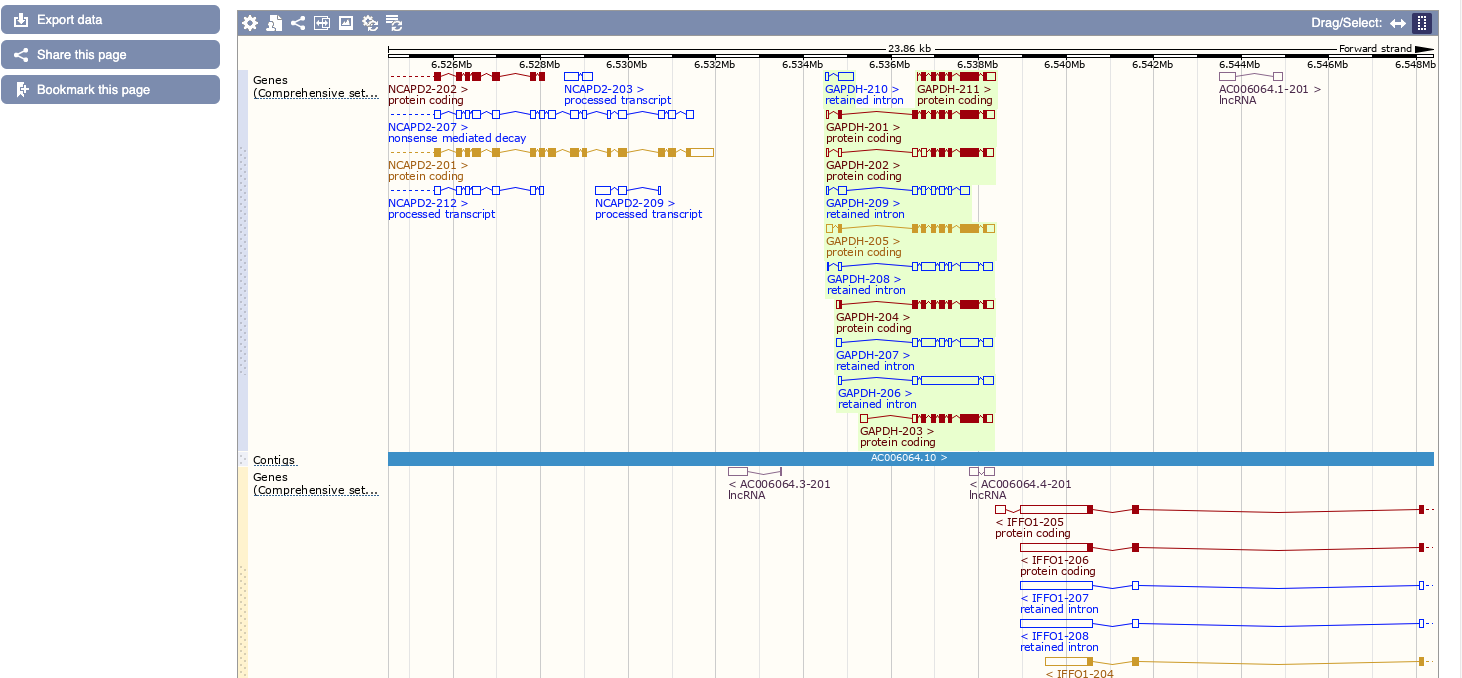
This will bring us to the genomic context with a zoom below on our specific location. Here, similar to UCSC, a number of features can be turned on/off by clicking on “configure this page”.
Demo #2
Let’s investigate the transcripts of the human GAPDH gene.
- Click on Show transcript table to see the list of transcripts and see the “tags” that are associated to each transcript and their meanings. Some transcripts are considered reference transcripts, while other are just predicted. Moving the mouse will reveal some information on those tags.
- We can see that we have both coding an non coding transcripts. We learnt in the previous course that the portion of non coding in our genome is bigger than the coding.
- From the menu on the left we can access the information about the protein produced by each transcript. We have the amino acid sequence.
- Also in this browser we can access the variations by going to Variants page on the menu on the left. We can use different filtering for detecting our variant of interest. Some are predicted by a number of programs, other have more solid evidences.
- We can also see associated diseases and phenotypes.
- The Gene expression menu on the left integrates the results from different databases. In this way you can quickly access the result of different experiments and the expression of your protein of interest in different tissues, organs.
- We can also access the pathway in which is involved our proteins. We can see in which part they are and what they do.
Exercise #2
Let’s investigate the transcripts of the human GAPDH gene.
- Click on Show transcript table to see the list of transcripts and see the “tags” that are associated to each transcript and their meanings. Some transcripts are considered reference transcripts, while other are just predicted. Which transcript is the reference and which tag is indicating this?
- Which transcripts is not coding for a protein?
- What do they produce?
- Click on the TSL tags. Different numbers can indicate which transcript has the best transcript support level. (i.e. is more likely to be a true transcript?)
- From the menu on the left, access the information about the protein produced by the reference transcript. Which amino acid indicates the presence of a splicing site?
- Access the Variants page on the menu on the left. Which variants have the most evidences?
- Use the Evidence filtering, how many have “Phenotype or disease”?
- Access the variant COSV57520906. Which phenotype is reported?
- Go to the Gene expression menu on the left. Filter for the colon. Which experiment indicates an expression in the appendix? Which part of the colon is found to express this gene by the GTEx consortium?
- Go to Pathway. How many pathways are shown for this gene?