

Functional analysis
Functional enrichment aims at determining whether known biological functions, ontologies or pathways are over-represented in a selected list of genes or gene products.
We will briefly present two of the most popular databases, along with two tools to assess functional enrichment in a selection of genes.
Data bases
Gene Ontology
![]()
The Gene Ontology (GO) describes gene products - in a species-independent manner - in terms of their associated:
| GO domains / root terms | Description |
|---|---|
| Molecular Functions | Molecular-level activities performed by gene products. e.g. catalysis, binding. |
| Biological Processes | Larger processes accomplished by multiple molecular activities. e.g. apoptosis, DNA repair. |
| Cellular Components | The locations where a gene product performs a function. e.g. cell membrane, ribosome. |
The structure of GO can be described as a graph: each GO term is a node, each edge represents the relationships between the nodes: child terms are more specialized than their parent terms.
For example:
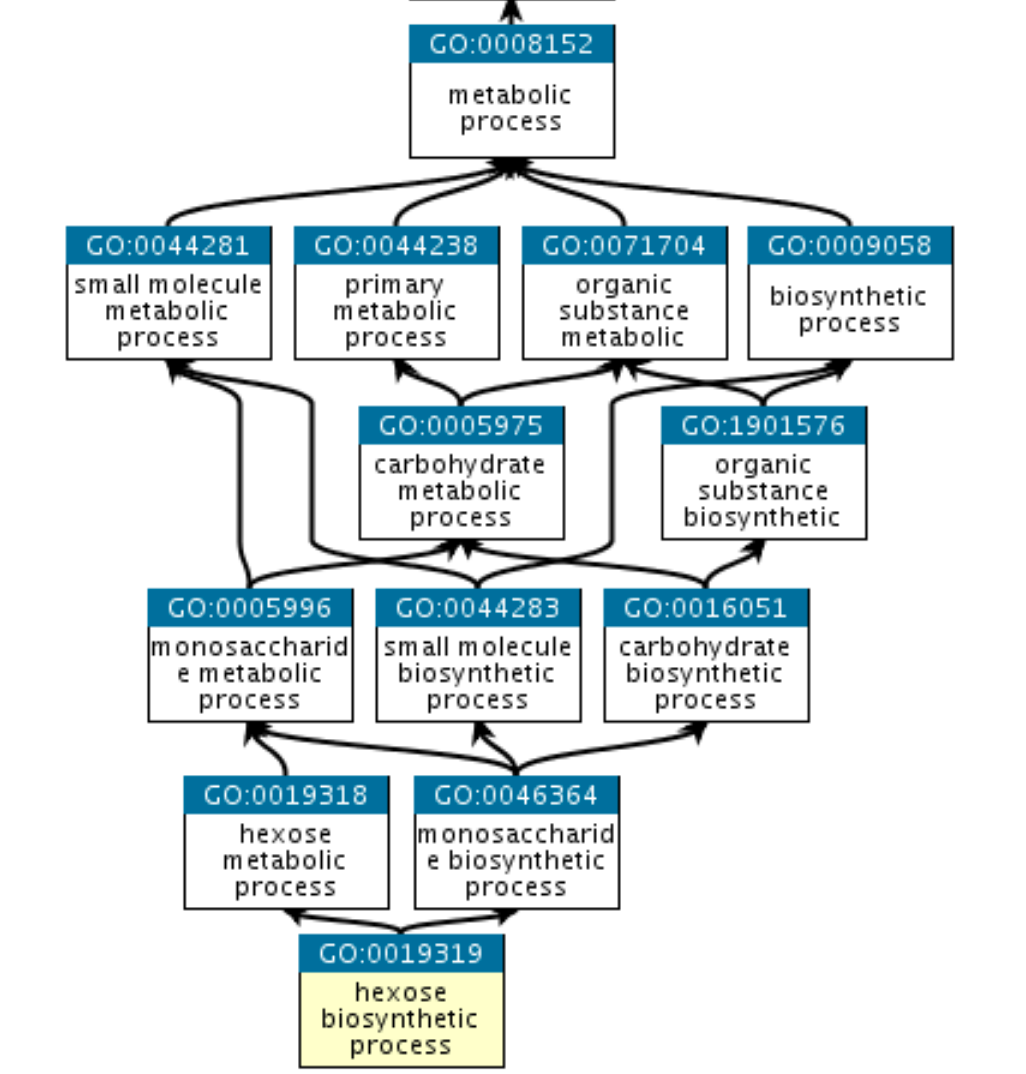
GO:0019319 (hexose biosynthetic process) is part of GO:0019318 (hexose metabolic process) and also part of GO:0046364 (monosaccharide biosynthetic process).
They all share common parent nodes, for example GO:0008152 (metabolic process), and eventually a root node that is here biological process.
EXERCISE
AmiGO is a good resource to view or download GO annotations.
- From the main page of AmiGO: go to Browse the Ontology:
- Add 2 filters: Organism: Arabidopsis thaliana and Type: lnc_RNA: what molecular functions to you get?
- Click on catalytic activity:
- What is the GO code for catalytic activity (mouse over the term).
- Click on catalytic activity to go to the page describing the ontology: how many genes and gene products are associated to catalytic activity ? How many for Mus musculus only?
KEGG pathways
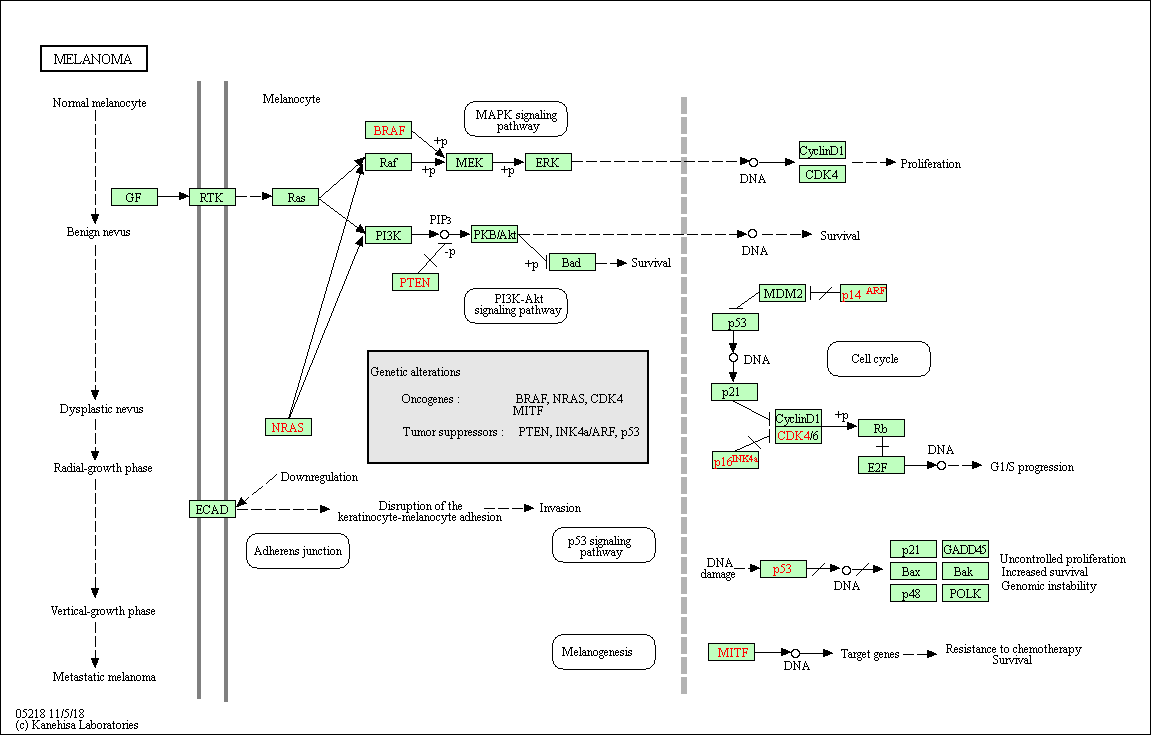
The Kyoto Encyclopedia of Genes and Genomes (KEGG) is a database for understanding high-level functions and utilities of the biological system.
It provides comprehensible manually-drawn pathways representing biological processes or disease-specific pathways.
Example of the Homo sapiens melanoma pathway:
Tools
Tools for functional enrichment can roughly be organized into 2 categories:
- Based on a selection of genes (most - and plenty of - tools).
- Based on a ranked list of genes (not many tools - the most widely used being GSEA).
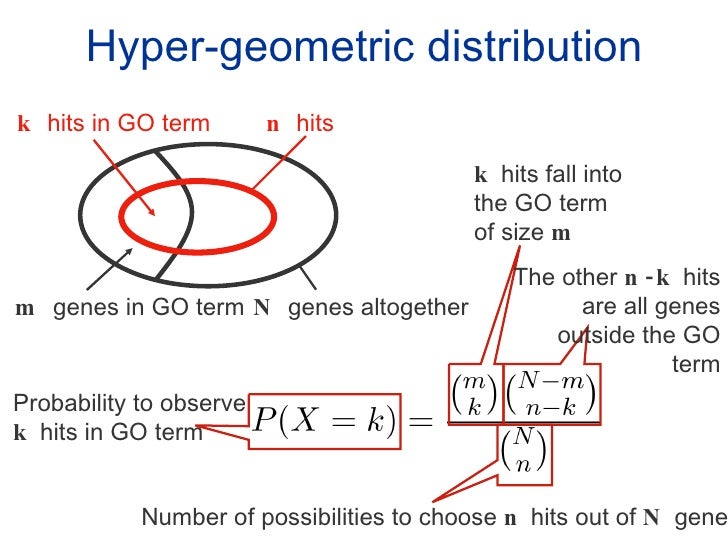
Many of the list-based tools use the Hypergeometric test or on the Fisher’s exact test. You can have a look at this page for some explanation of both tests.
Those tools based on a user-selection of genes usually require 1 or 2 input file(s):
- List of genes selected from the universe (required): based on differential gene expression results. For example, adjusted / corrected p-value < 0.05.
- Gene Universe (optional): all genes present in a system: in the case of a high throughput assay, it would be all genes used in the analysis/annotation
We will play with two tools that perform such enrichment:
- Enrichr: takes one file as an input (the gene selection only) and quieries many databases.
- GOrilla: takes two files as inputs (the gene selection and the universe/background) and queries the GO database only.
EnrichR
EnrichR is a gene-list enrichment tool developped at the Icahn Schoold of Medicine (Mount Sinai).
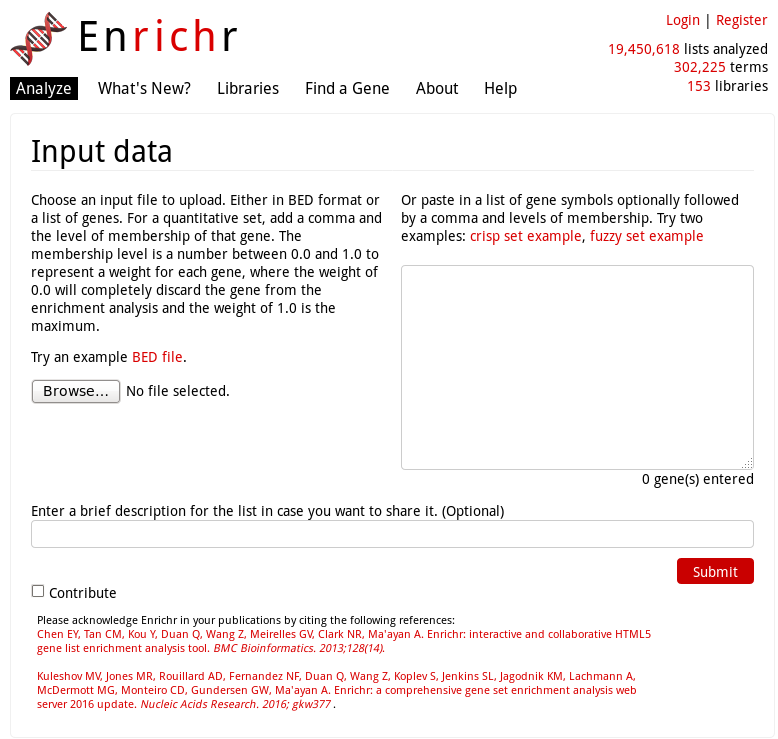
It does not require the input of a gene universe: only a selection of genes or a BED file.
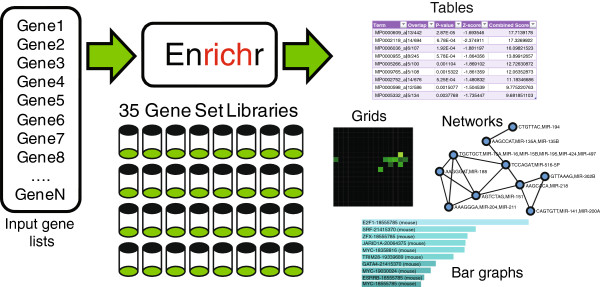
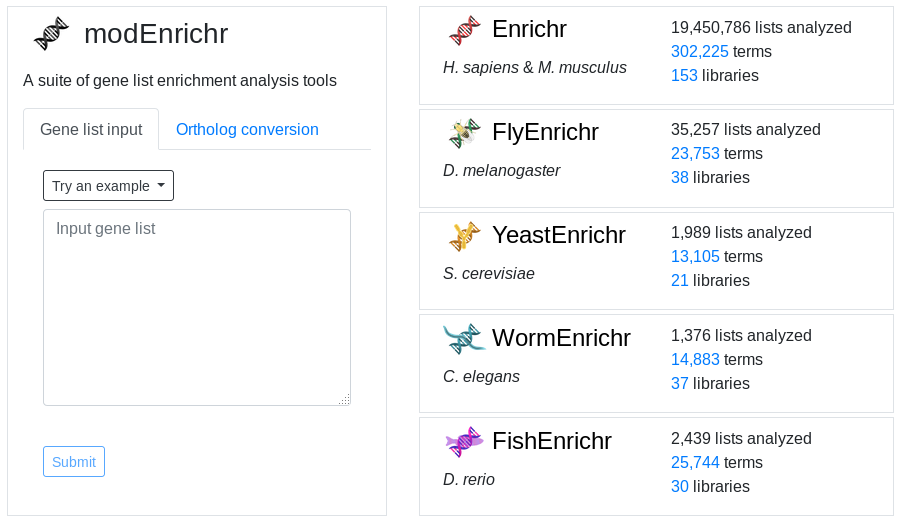
The default EnrichR interface works for Homo sapiens and Mus musculus.
However, EnrichR also provides a set of tools for ortholog conversion and enrichment analysis of more organisms:
In the main page, click on Try a gene set example to get a test list of genes. And Submit.
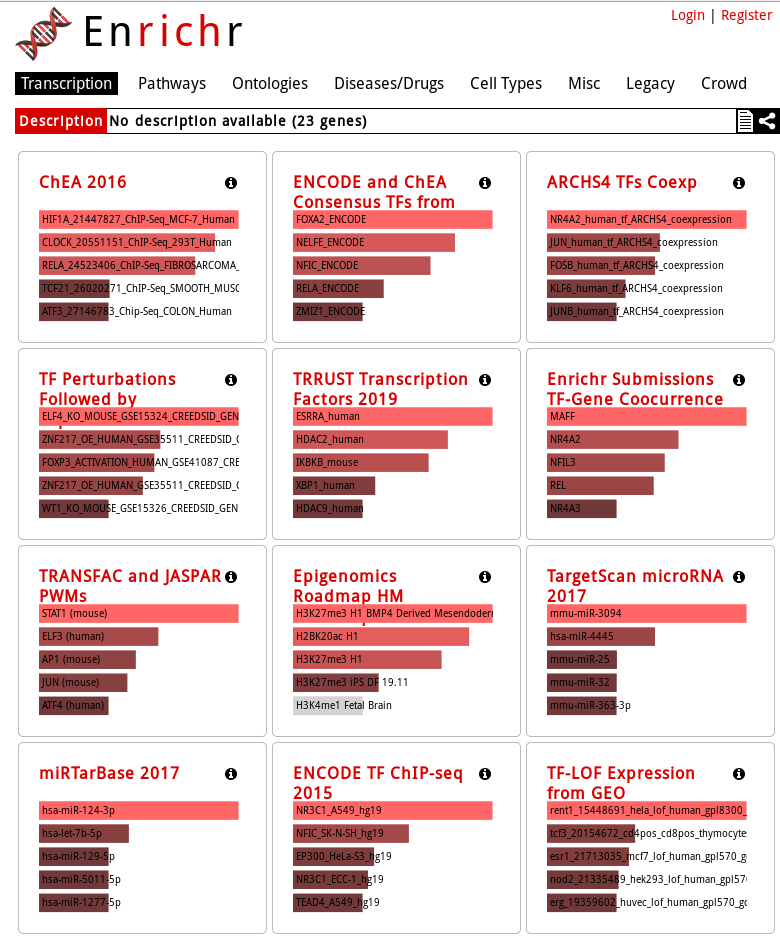
EnrichR tests enrichment of a lot of different gene sets, organized in 8 categories:
- Transcription
- Pathways
- Ontologies
- Diseases/Drugs
- Cell Types
- Misc
- Legacy
- Crowd
More details about each data base analysed can be found here
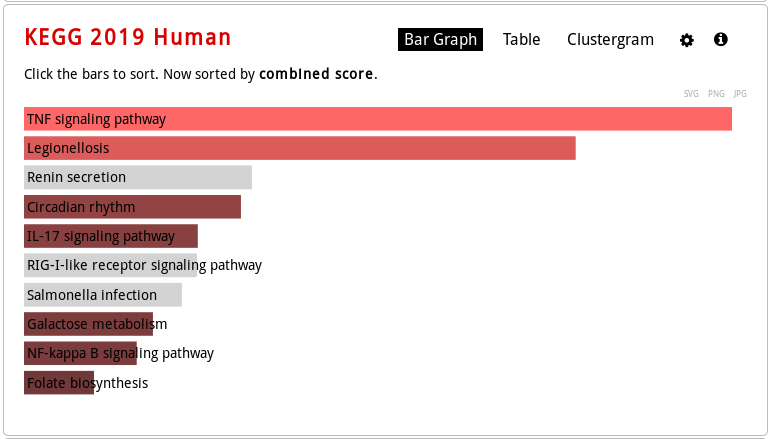
As you browse, for example, the Pathways tab, you will see that the results can be explored different ways:
-
bar graph visualization (mouse over to see the enrichment statistics):
-
table visualization (mouse over a row to see the genes involved):
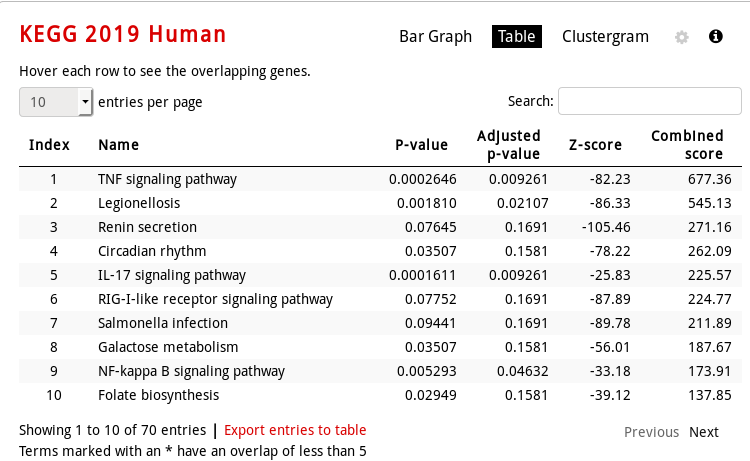
-
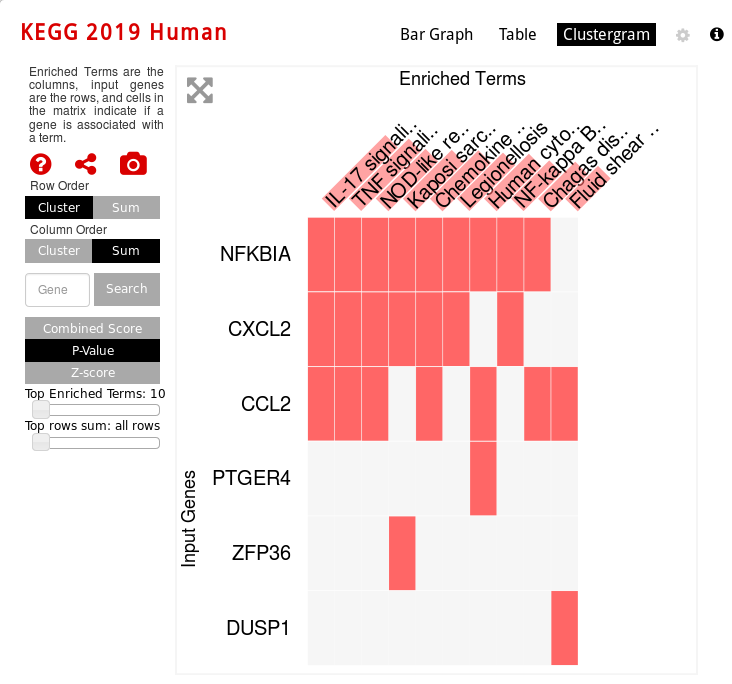
clustergram vizualization (which genes are involved in which enriched pathway):
You can also export some graphs as PNG, JPEG or SVG.
EXERCISE
- Download file selection_Human.txt from this page (click right on the file name -> save link as): it contains 40 genes. We will try and find out what ontologies / pathways are enriched in this list of genes.
- Load this file as input data in Enrichr
- For which KEGG pathway (consider the top one only) this list of genes is enriched? What is the p-value? The q-value? How many genes from our list are involved in this pathway?
- What about the Gene Ontology enrichment? How many Biological processes are enriched if you consider an adjusted p-value < 0.05 threshold ? You can “export entries to table”…
GOrilla
GOrilla is a tool for Gene Ontology enRIchment anaLysis and visuaLizAtion.
There are 2 ways to run GOrilla:
- Search for enriched GO terms that appear densely at the top of a ranked list of genes.
- Search for enriched GO terms in a selection of genes compared to a background list of genes (universe).
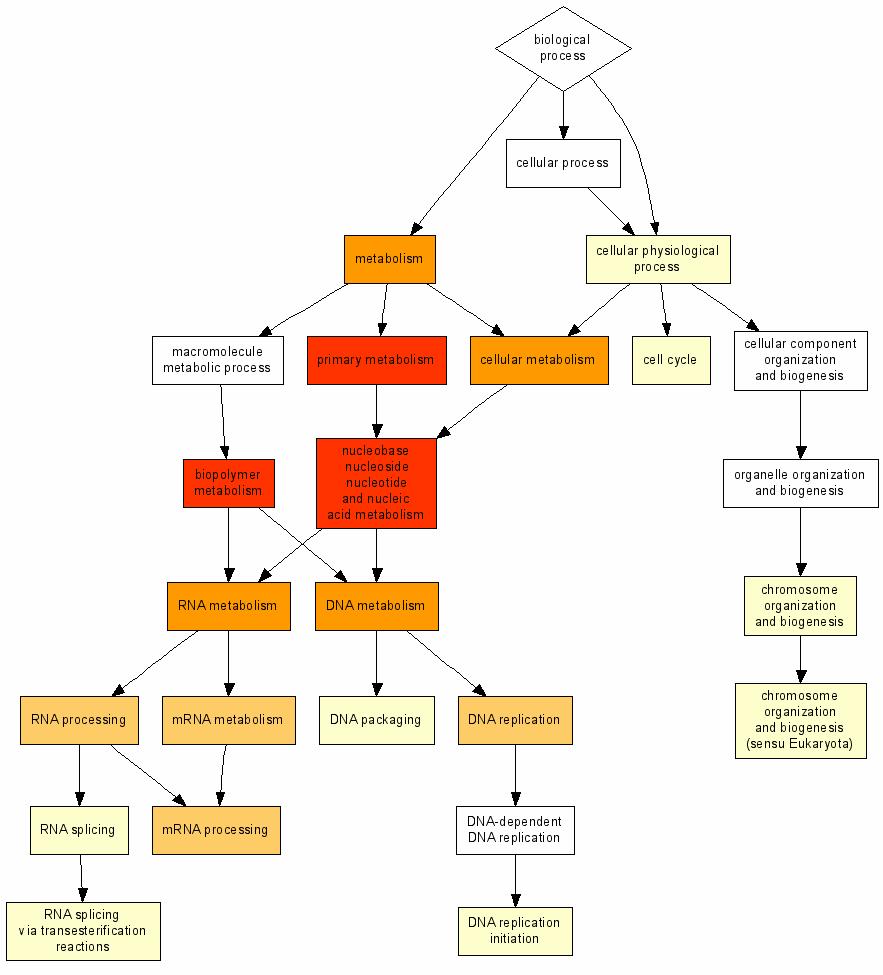
GOrilla’s results provide a list of enriched list of Gene Ontologies, along with the corresponding GO tree:
EXERCISE
- Download file background_Human.txt from this page (click right on the file name -> save link as): it contains our universe/background list of genes.
- Run the enrichment tool:
- Step 1: Choose organism: Homo sapiens
- Step 2: Choose running mode: Two unranked lists of genes (target and background lists)
- Step 3: Paste a ranked list of gene/protein names: as Target Set, pick file selection_Human.txt, and as Background Set, pick file background_Human.txt.
- Step 4: Choose an ontology: Process.
- Hit ENRICHED GO TERMS
- What are the top 5 enriched biological processes (scroll down below the graph)? How many genes are involved in the regulation of stress-activated MAPK cascade ?
More tools to explore
Web interface:
Using R/Bioconductor: