19.3 Box plots
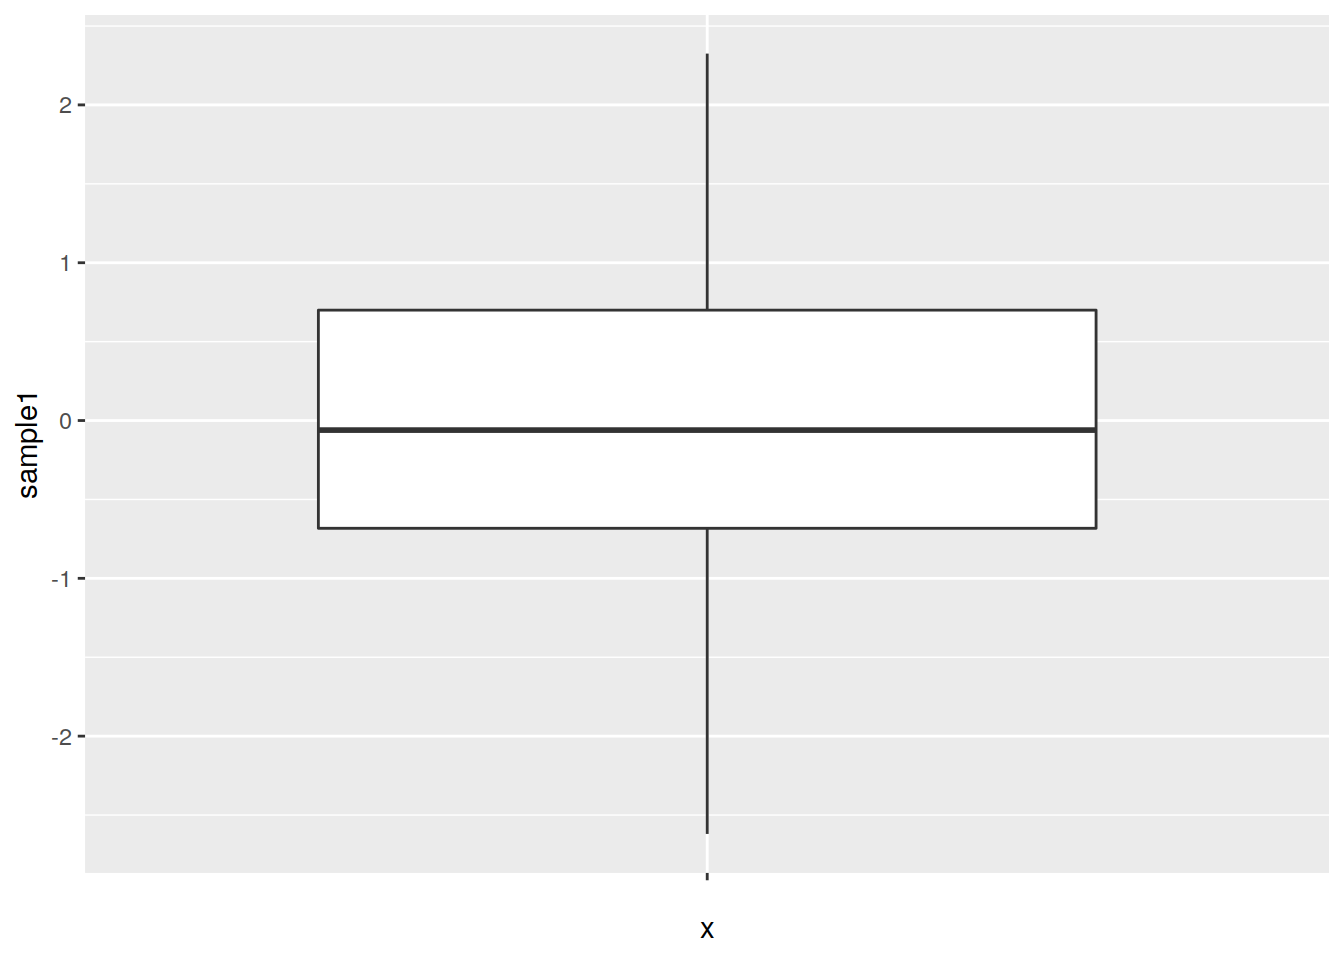
- Simple boxplot showing the data distribution of sample 1:
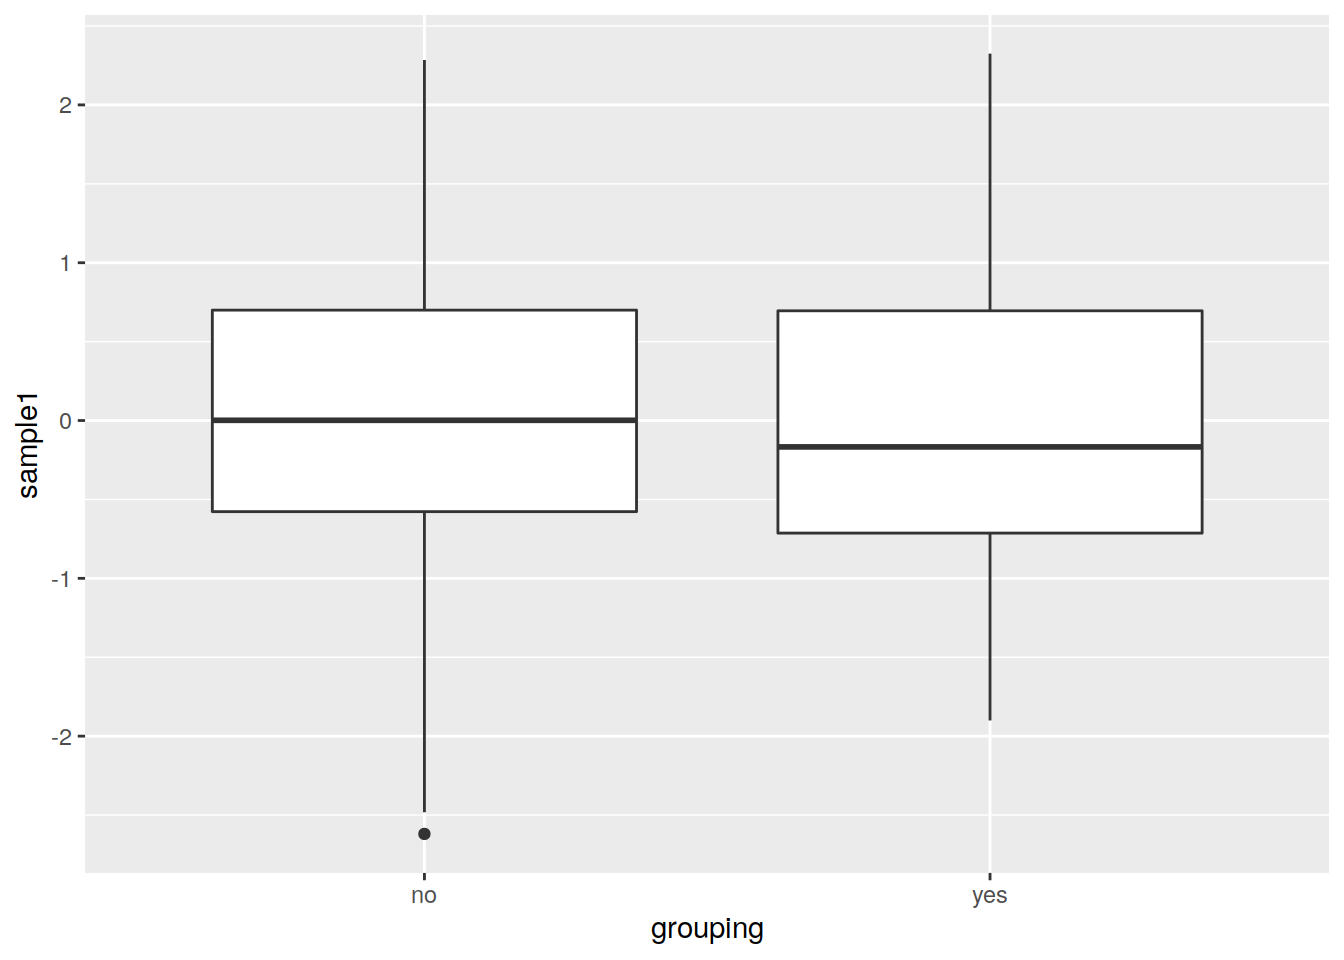
- Split the data into 2 boxes:
- What if you want to plot both sample1 and sample2 ?
You need to convert into a long format
What is the long format ?
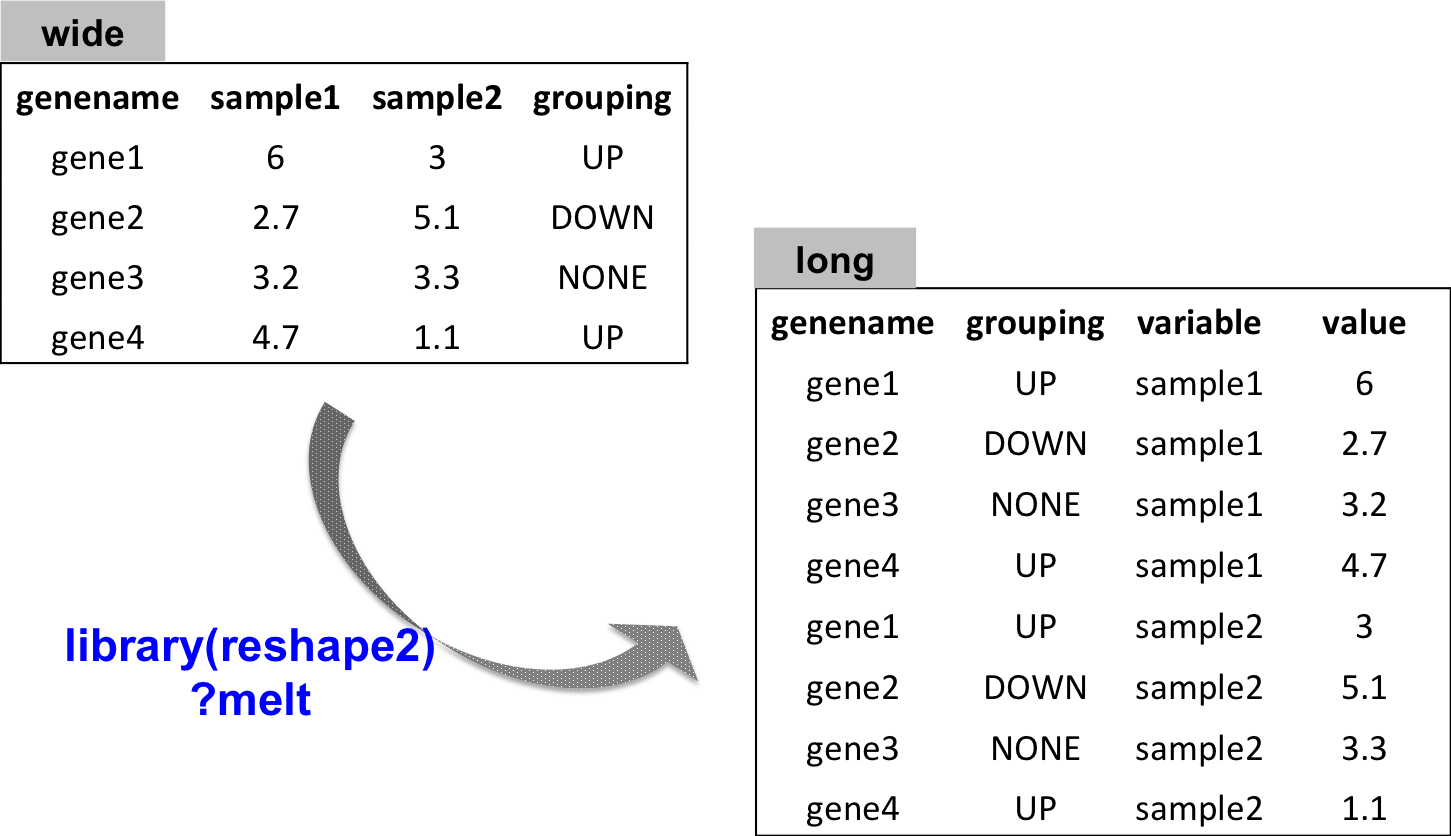
Plotting both sample1 and sample2:
# load package
library("reshape2")

# convert to long format
df_long <- melt(data=df2)
    # all numeric values are organized into only one column: value
# plot:
ggplot(data=df_long, mapping=aes(x=variable, y=value)) +
  geom_boxplot()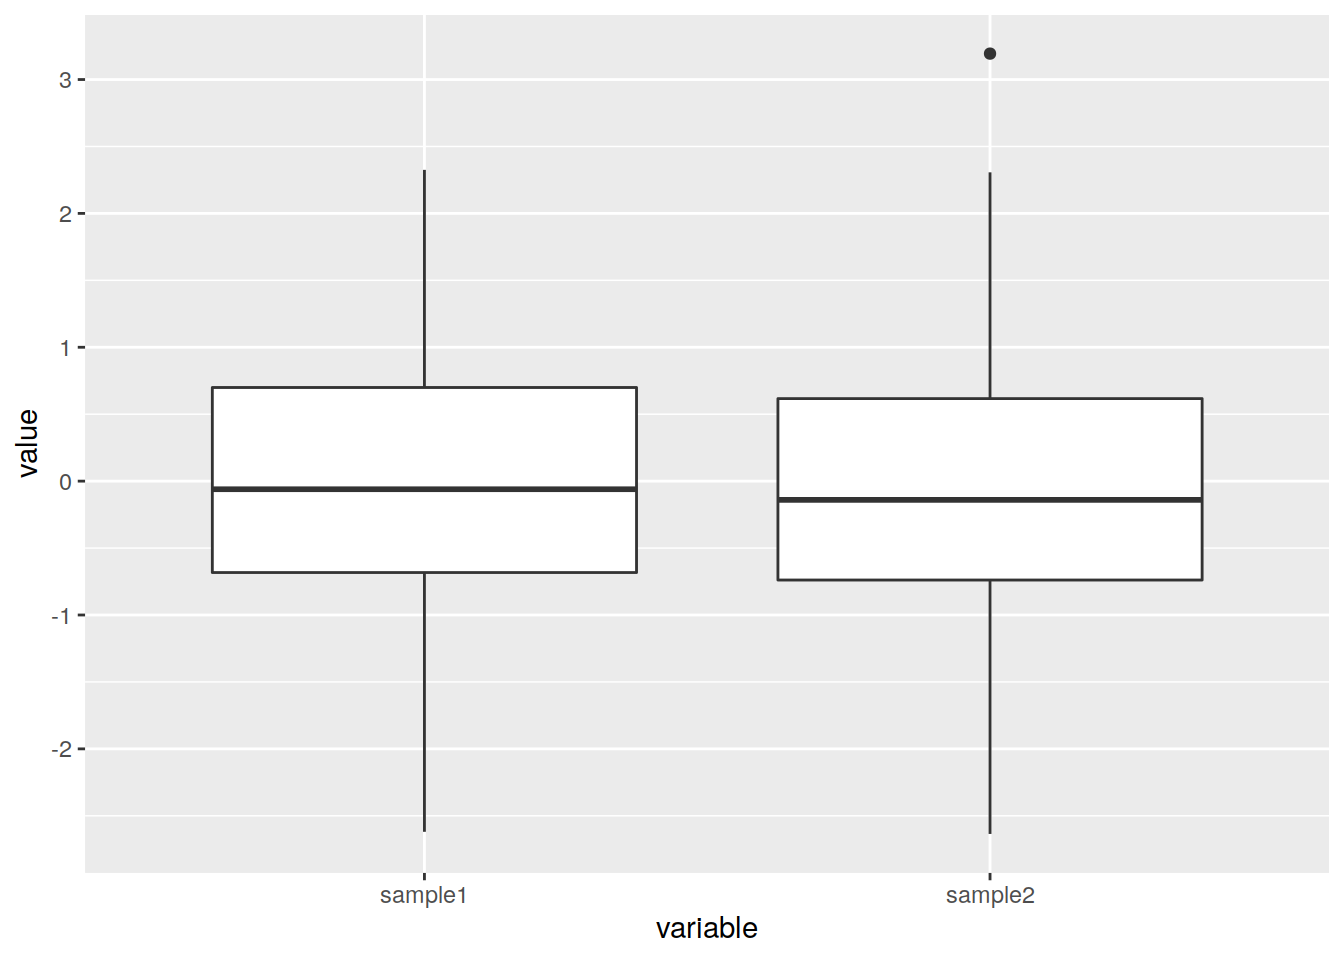
- What if now you also want to see the distribution of “yes” and “no” in both sample1 and sample2 ?
Integrate a parameter to the aes()
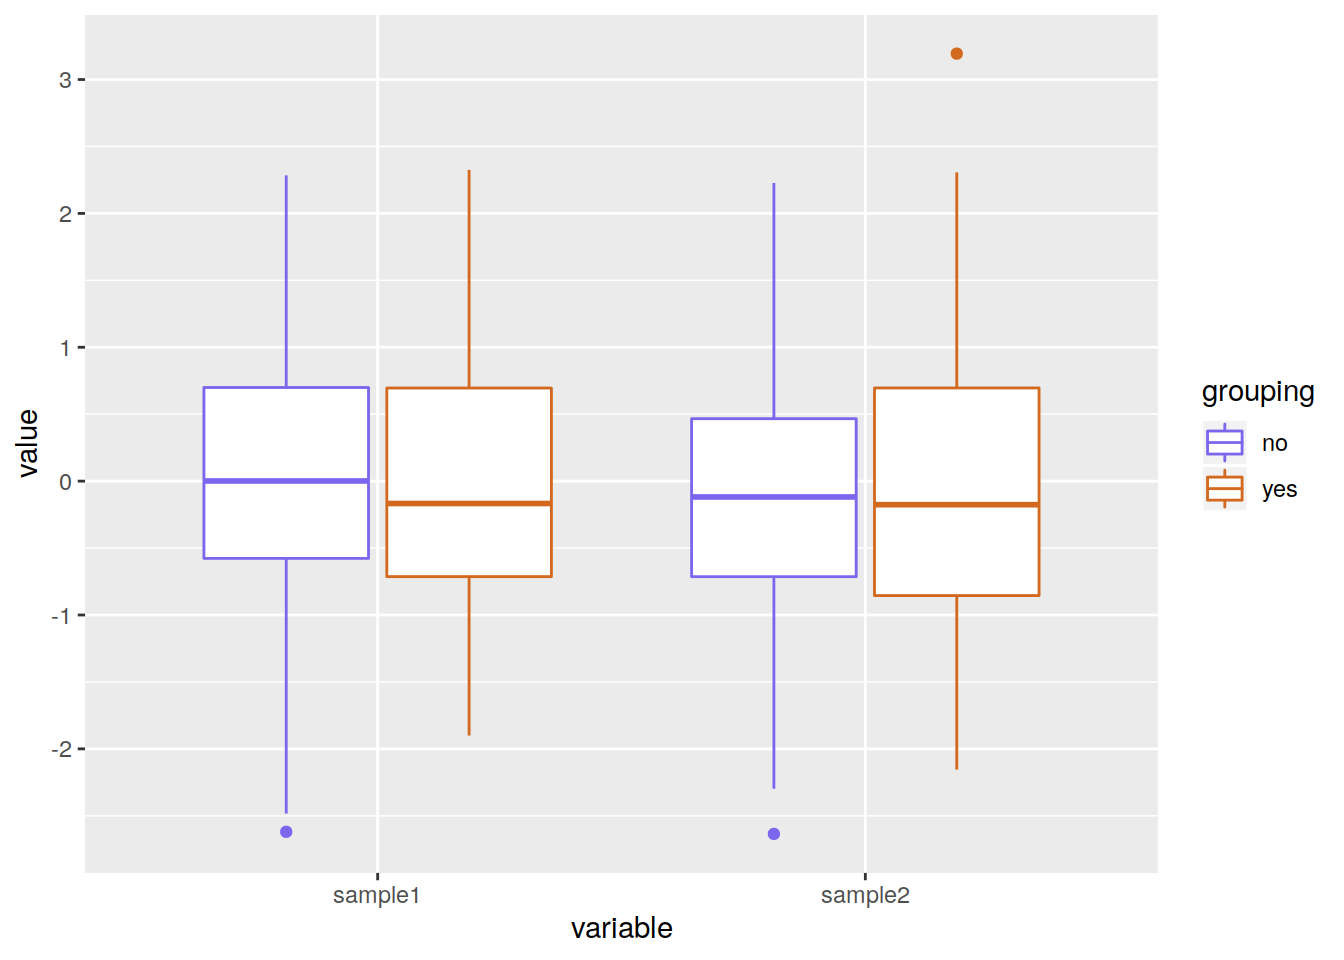
# Either color (color of the box border)
ggplot(data=df_long, mapping=aes(x=variable, y=value, color=grouping)) +
  geom_boxplot()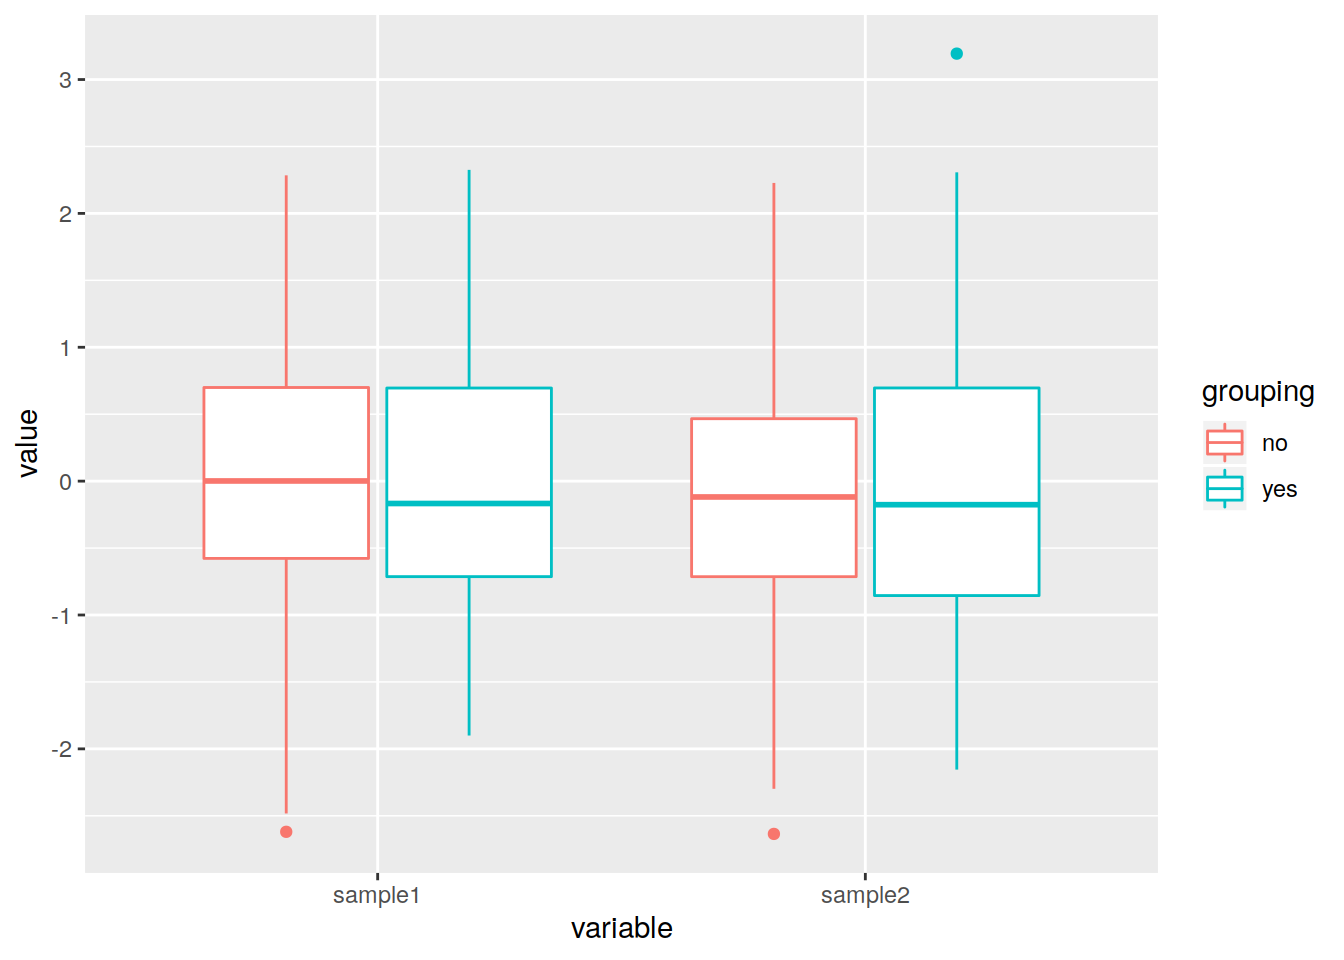
# Or fill (color inside the box)
ggplot(data=df_long, mapping=aes(x=variable, y=value, fill=grouping)) +
  geom_boxplot()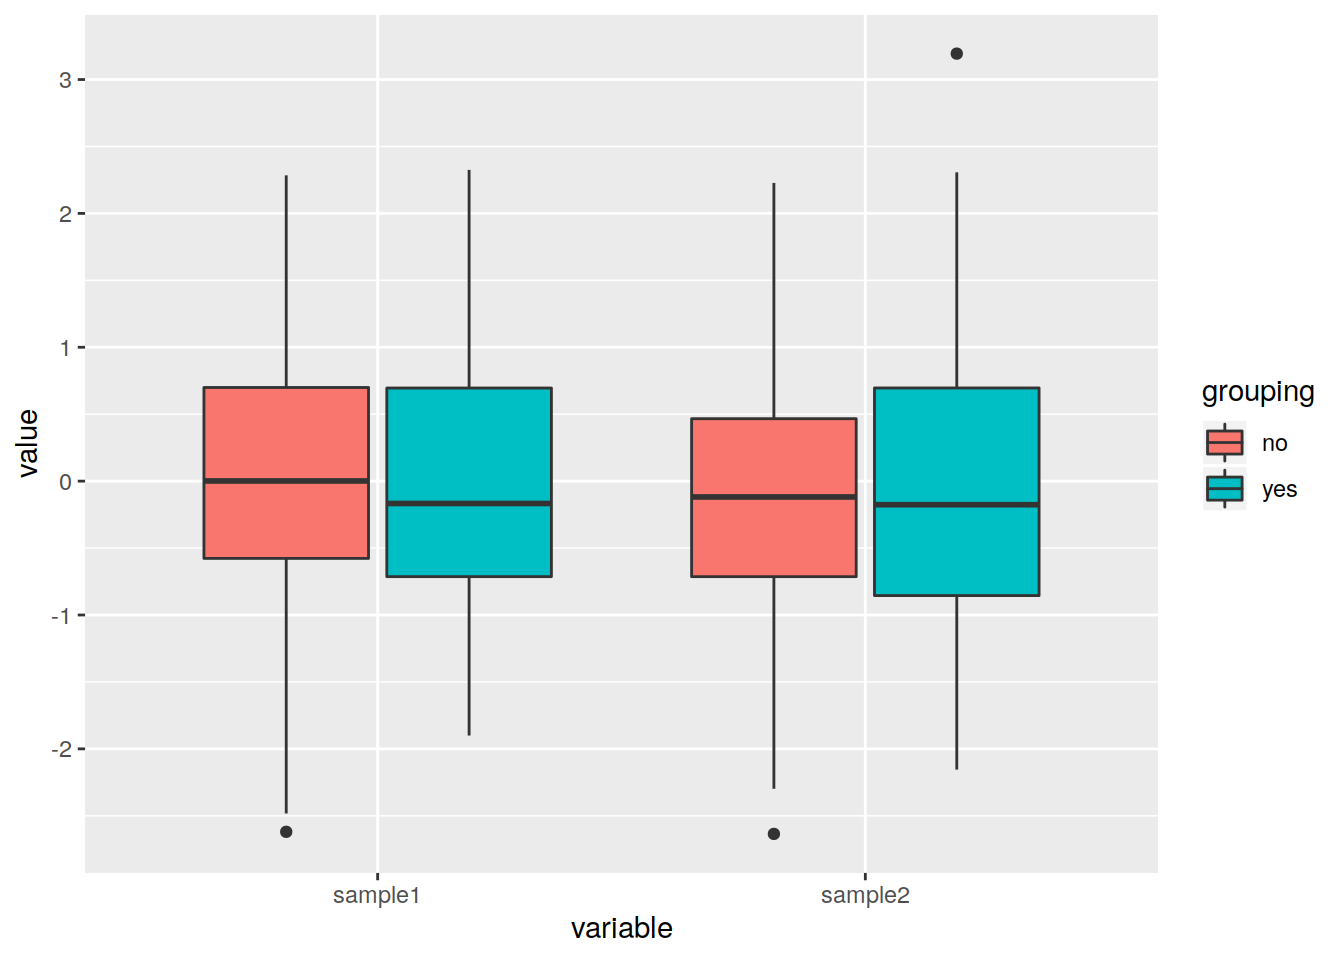
Do you want to change the default colors?
- Integrate either layer:
- scale_color_manual() for the boxes border color
- scale_fill_manual() for the boxes color (inside)
pbox_fill <- ggplot(data=df_long, mapping=aes(x=variable, y=value, fill=grouping)) +
    geom_boxplot() +
    scale_fill_manual(values=c("slateblue2", "chocolate"))

pbox_fill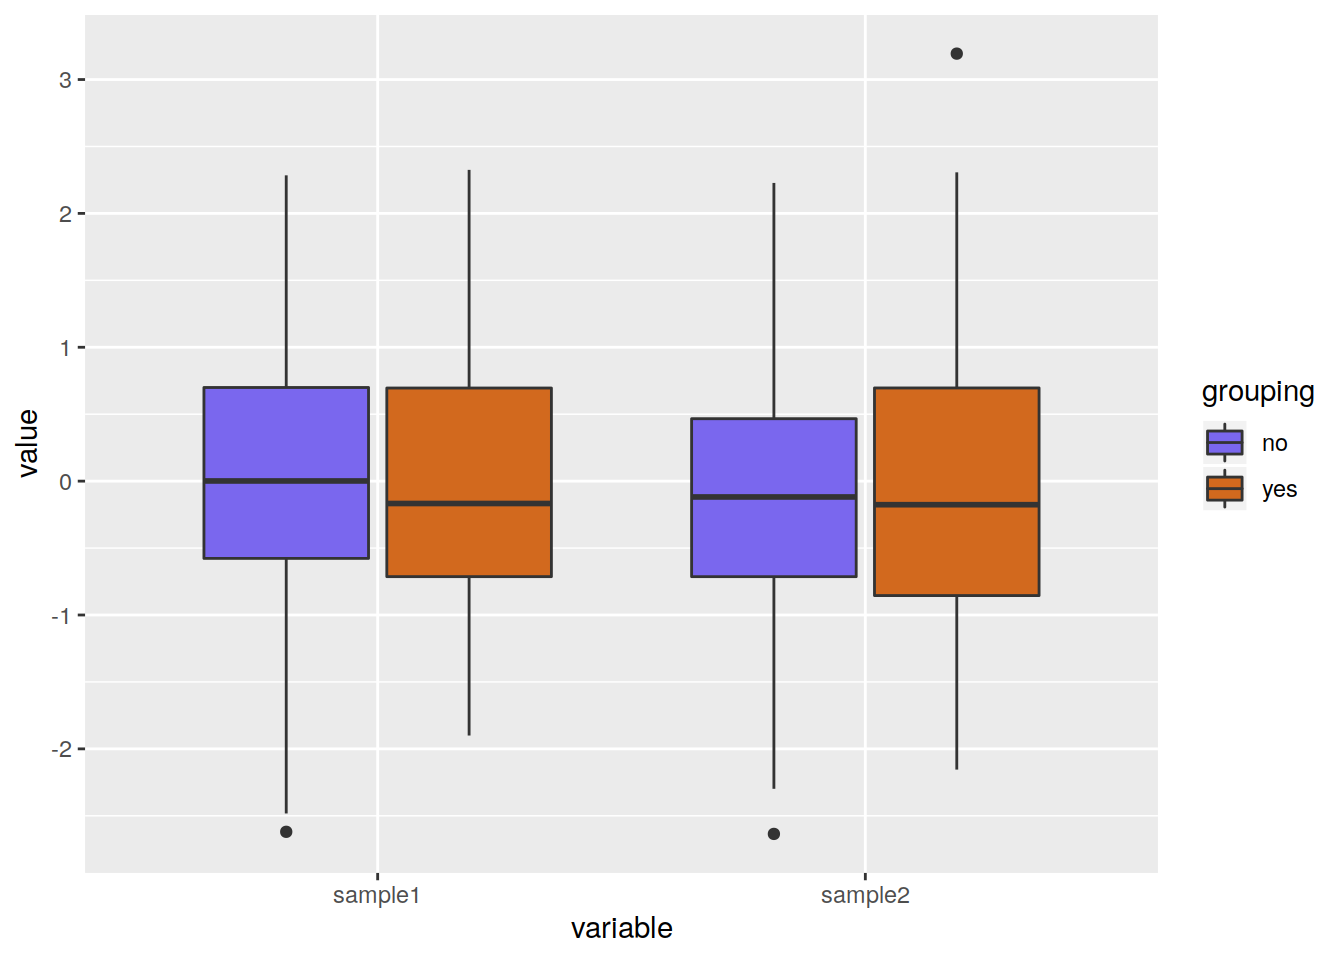
pbox_col <- ggplot(data=df_long, mapping=aes(x=variable, y=value, color=grouping)) +
        geom_boxplot() +
        scale_color_manual(values=c("slateblue2", "chocolate"))
pbox_col