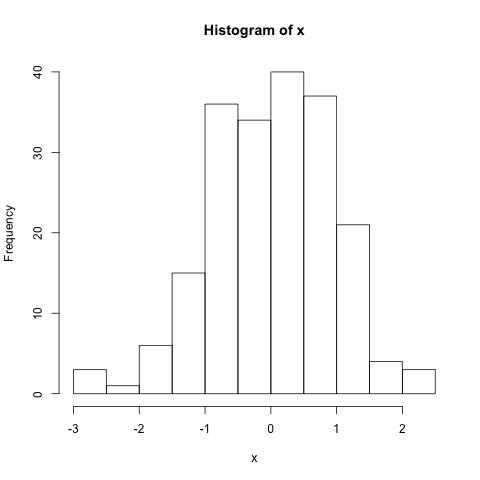
A histogram graphically summarizes the distribution of the data.
# Vector of 200 random values from the normal distribution
x <- rnorm(200)

# Plot histogram
hist(x)
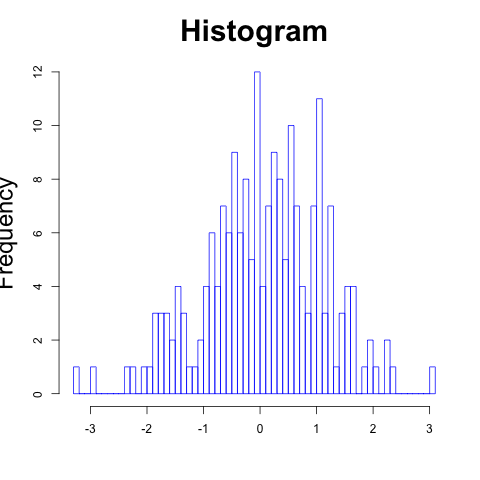
hist(x,
    border="blue",
    breaks=50,
    main="Histogram",
    xlab="",
    cex.main=2.5,
    cex.lab=2)