16.4 Box plots
A boxplot is a convenient way to describe the distribution of the data.
- A simple boxplot:
# Create a matrix of 1000 random values from the normal distribution (4 columns, 250 rows)
x <- matrix(rnorm(1000), ncol=4)

# Basic boxplot
boxplot(x)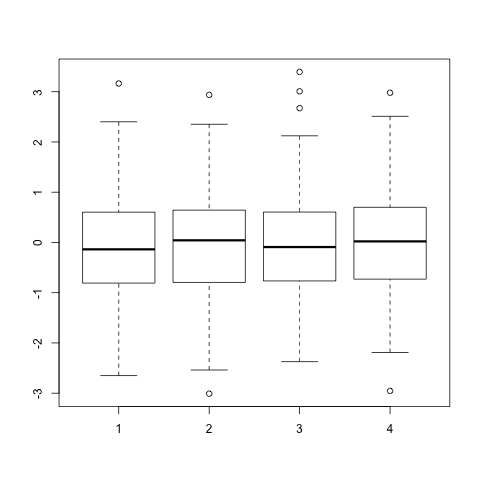
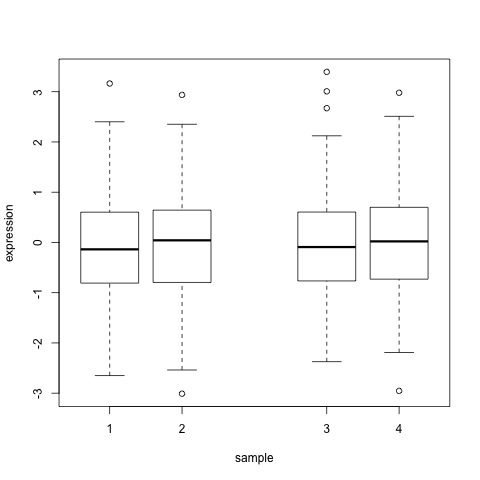
- Add some arguments :
- xlab: x-axis label
- ylab: y-axis label
- at: position of each box along the x-axis: here we skip position 3 to allow more space between boxes 1/2 and 3/4
- Add an horizontal line at y=0 with abline(); arguments of abline :
- h : y-axis starting point of horizontal line (v for a vertical line)
- col : color
- lwd : line thickness
- lty : line type
# First plot the box plot as before:
boxplot(x,
    xlab="sample",
    ylab="expression",
    at=c(1, 2, 4, 5),
     main="my boxplot")

# Then run the abline function
abline(h=0, col="red", lwd=3, lty="dotdash")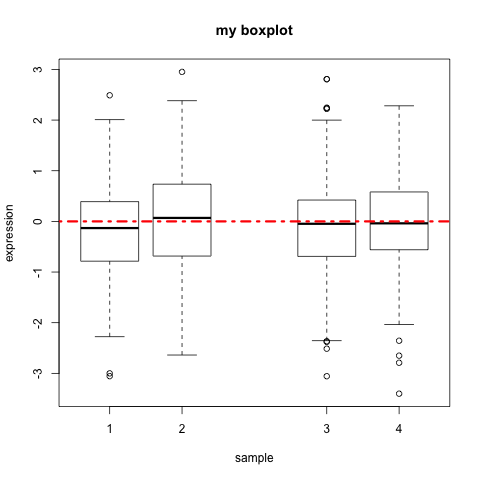
- Line types in R:
