19.6 Histograms
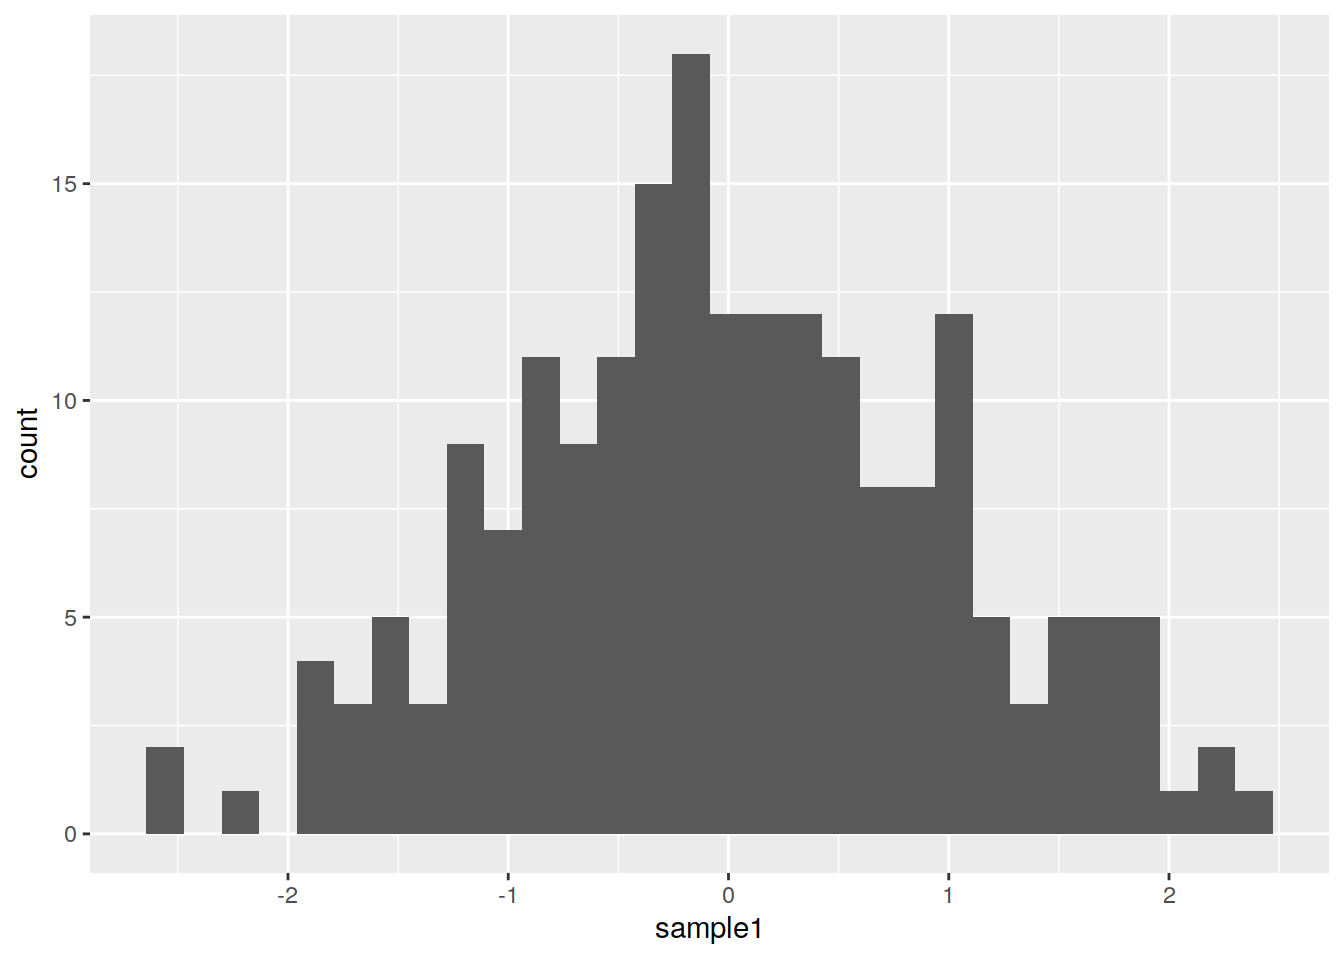
Simple histogram on one sample (using the df2 data frame):
## `stat_bin()` using `bins = 30`. Pick better value with `binwidth`.
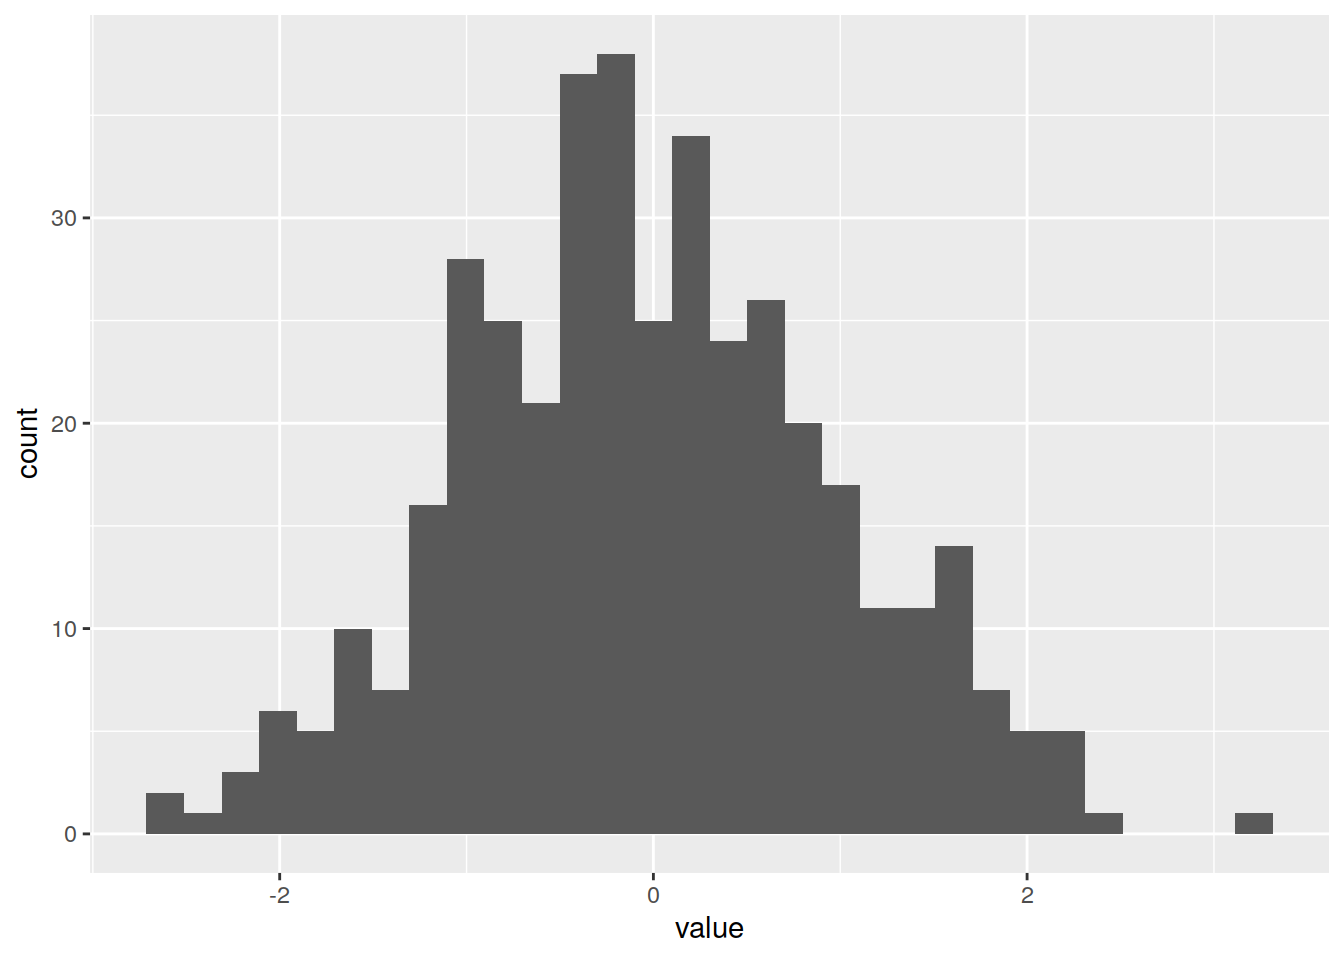
Histogram on more samples (using df_long):
## `stat_bin()` using `bins = 30`. Pick better value with `binwidth`.
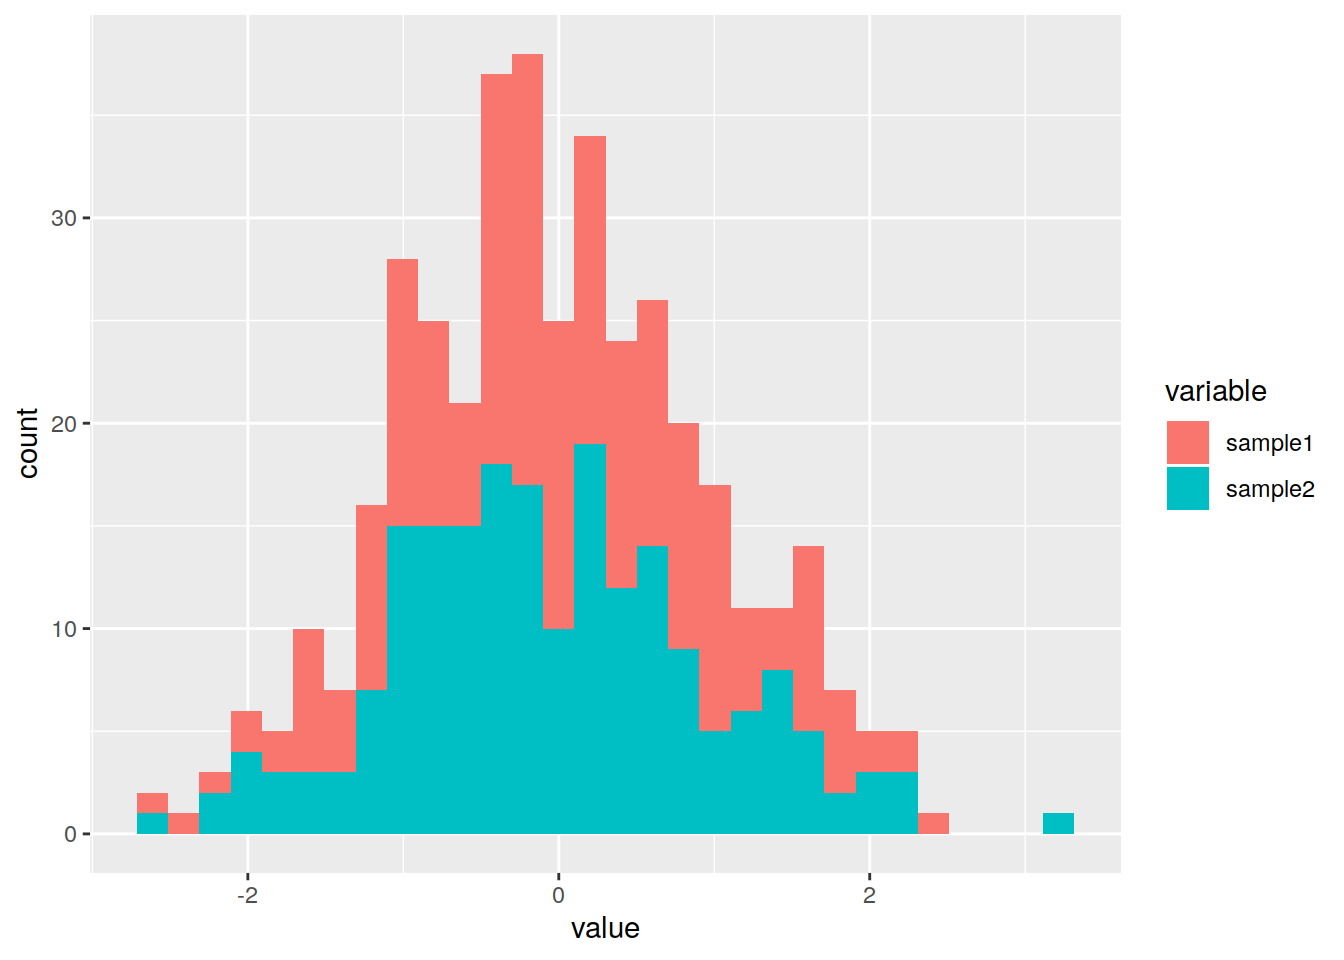
Split the data per sample (“variable” column that represents here the samples):
## `stat_bin()` using `bins = 30`. Pick better value with `binwidth`.
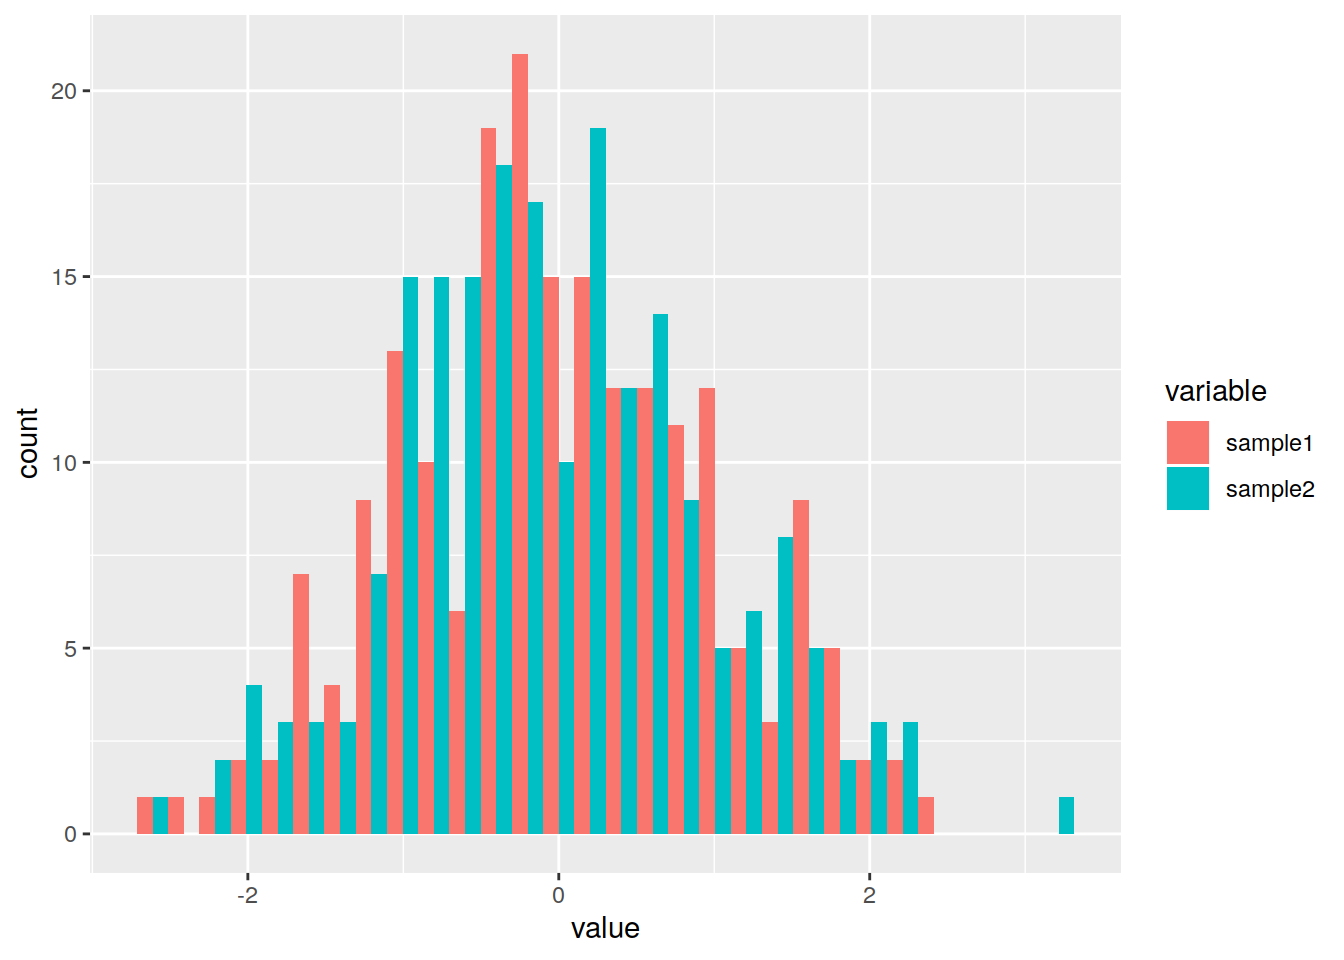
By default, the histograms are stacked: change to position dodge (side by side):
phist <- ggplot(data=df_long, mapping=aes(x=value, fill=variable)) +
    geom_histogram(position='dodge')
phist
## `stat_bin()` using `bins = 30`. Pick better value with `binwidth`.