18.1 heatmap.2 function from gplots package
A heatmap is a graphical representation of data where the values are represented with colors.
The heatmap.2 function from the gplots package allows to produce highly customizable heatmaps.
# load package
library("gplots")

# make matrix
mat <- matrix(rnorm(1200), ncol=6)

# heatmap with the defaults parameters
heatmap.2(x=mat)
- Useful arguments include:
- Rowv, Colv : process clustering of columns or rows (default TRUE to both)
- dendrogram : show dendrogram for row, col, both or none
- scale : scale data per row, column, or none
- col : dendrogram color palette
- trace : control the cyan density lines
- RowSideColors, ColSideColors : block of colors that represent the columns or the rows
- labRow,labCol : remove or keep row or col labels
- main : title
- xlab, ylab: x-axis or y-axis label
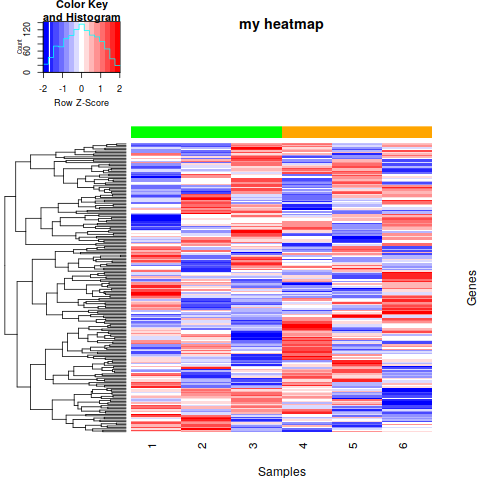
heatmap.2(x=mat,
    Colv=FALSE,
    dendrogram="row",
    scale="row",
    col="bluered",
    trace="none",
    ColSideColors=rep(c("green","orange"), each=3),
    labRow=FALSE,
    main="my heatmap",
    ylab="Genes",
    xlab="Samples")