16.4 Bar plots
# A simple bar plot
ggplot(data=df2, mapping=aes(x=grouping)) + geom_bar()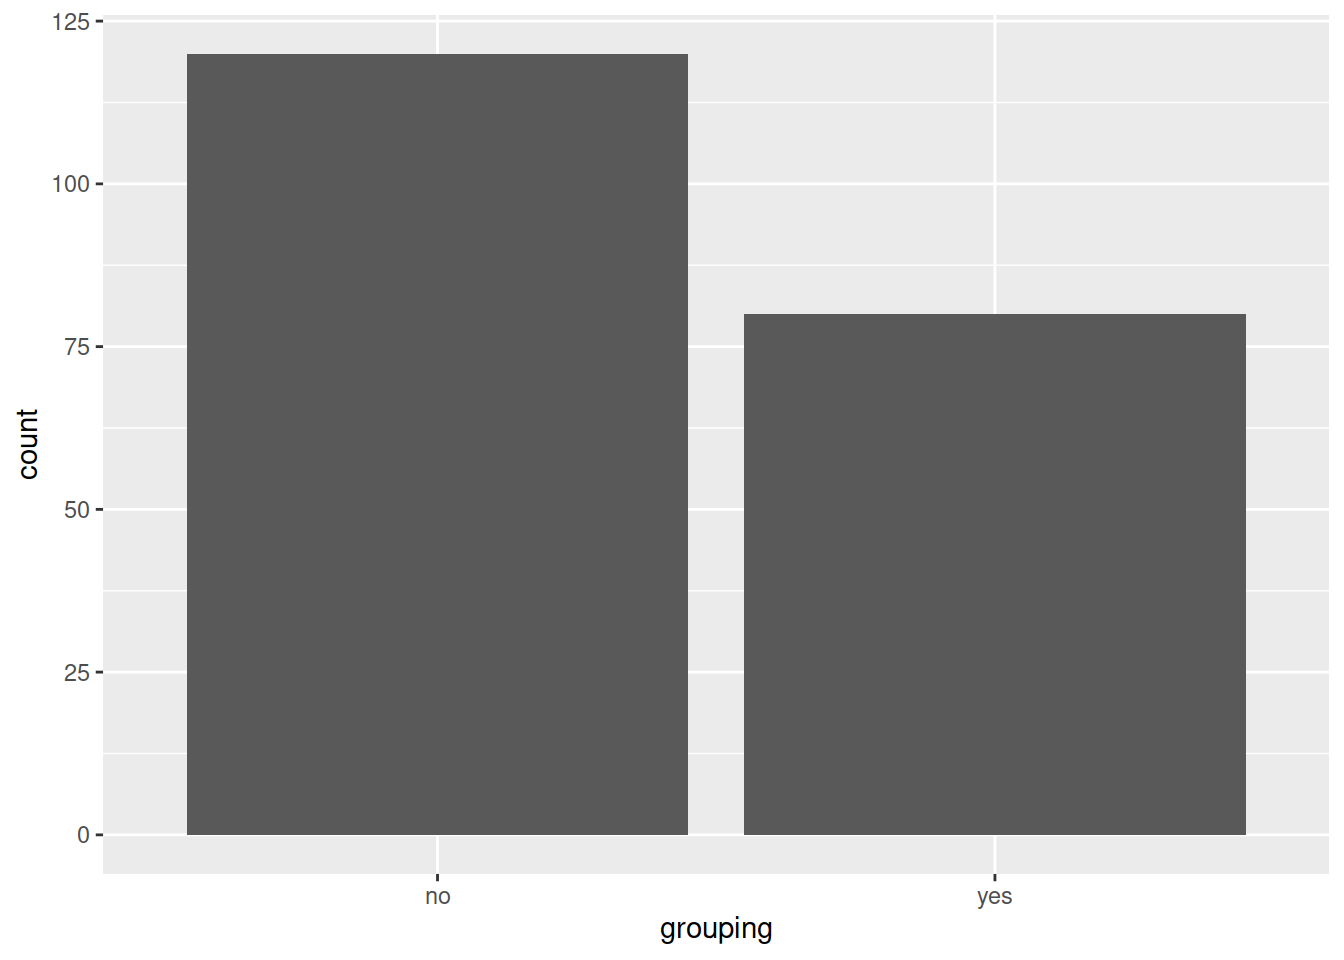
- Customize:
- scale_x_discrete is used to handle x-axis title and labels
- coord_flip swaps the x and y axis
# Save the plot in the object "p"
pbar <- ggplot(data=df2, mapping=aes(x=grouping, fill=grouping)) +
  geom_bar()

pbar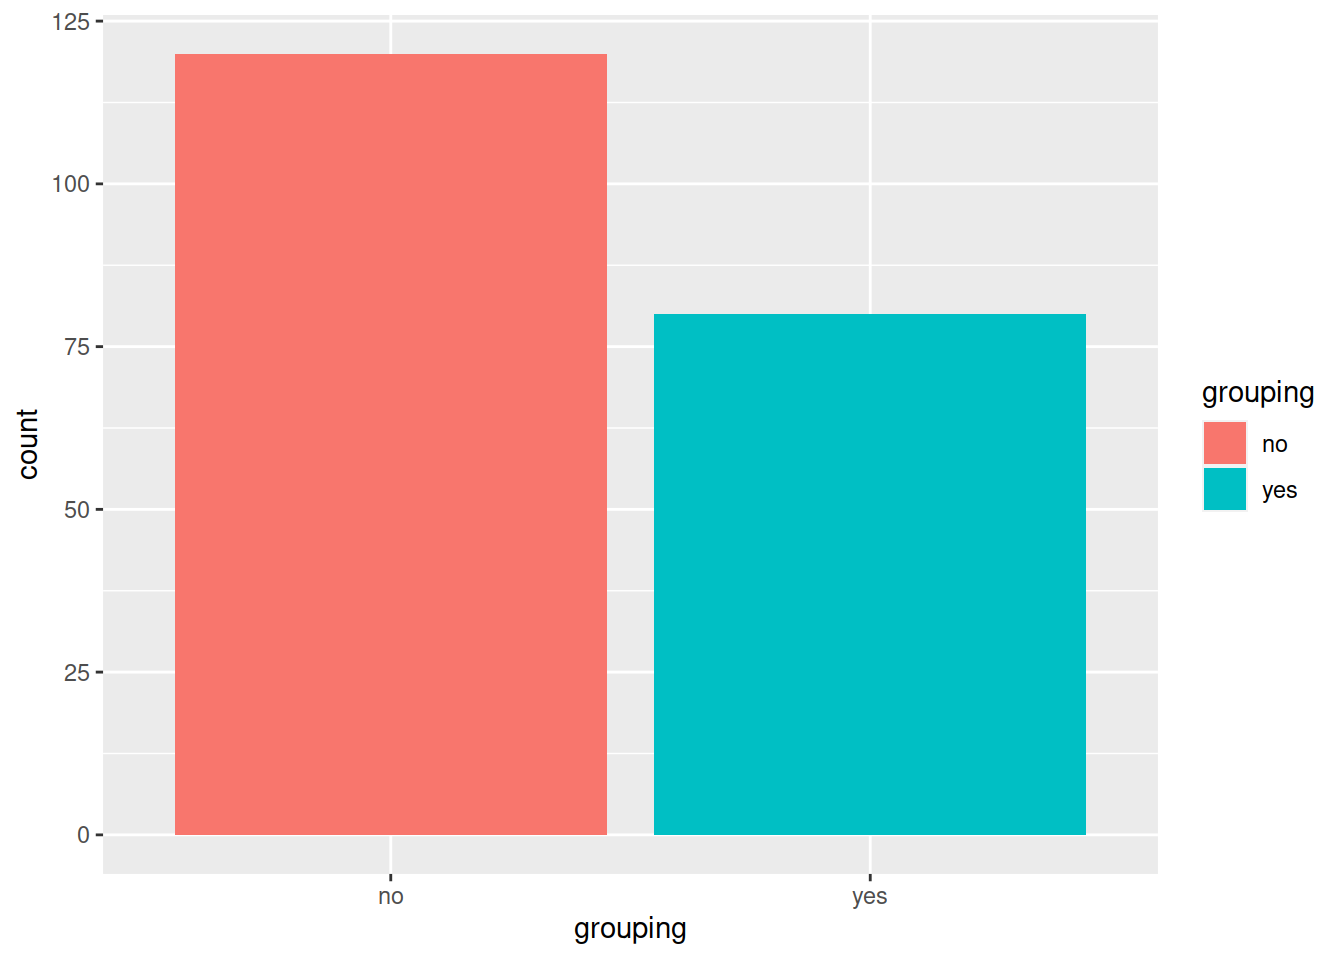
# Change x axis label with scale_x_discrete and change order of the bars:
p2 <- pbar + scale_x_discrete(name="counts of yes / no", limits=c("yes", "no"))

p2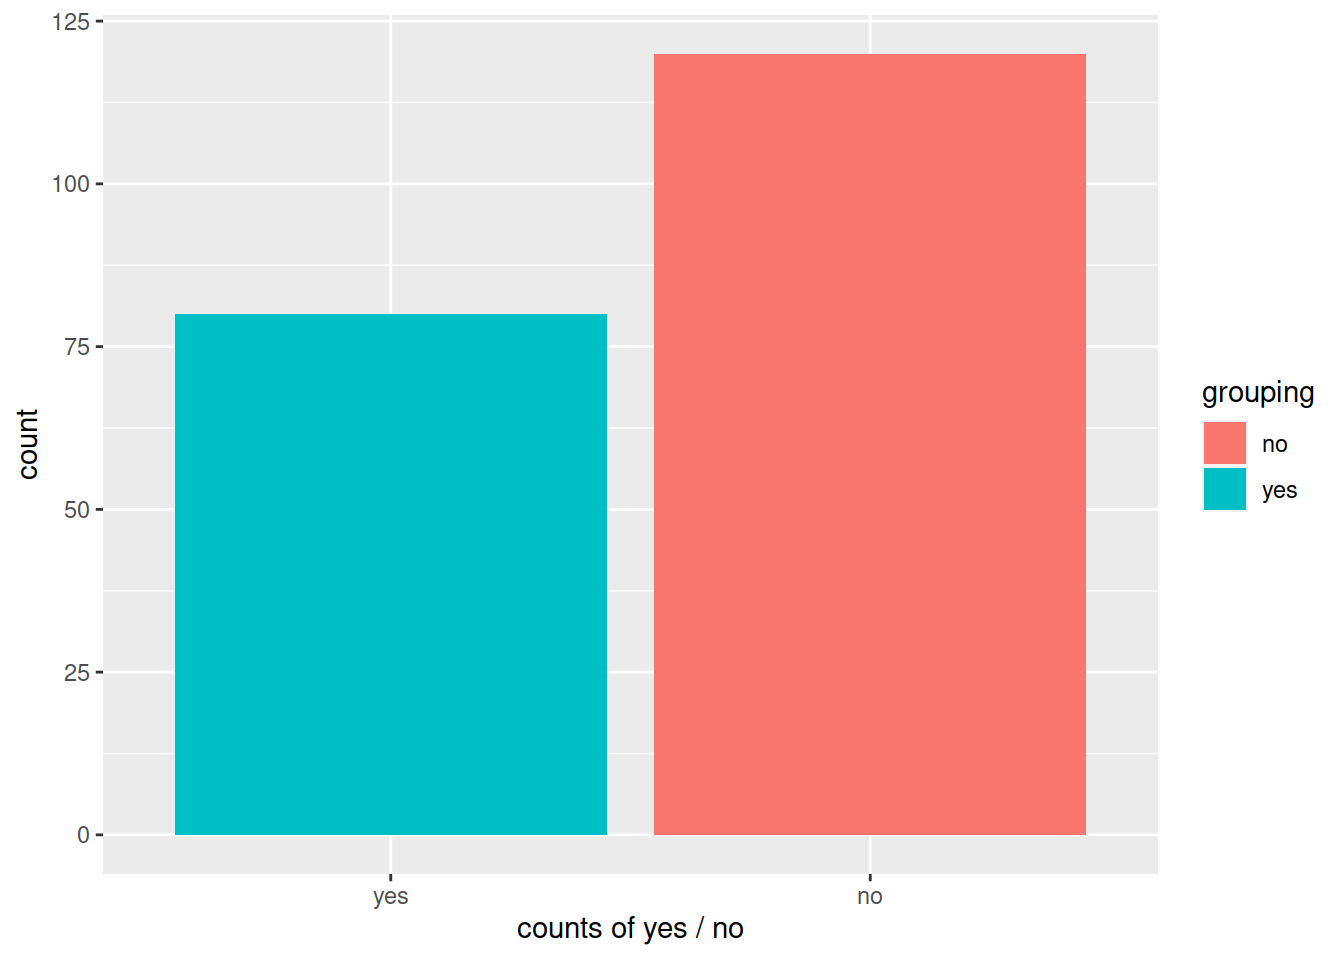
# Swapping x and y axis with coord_flip():
p3 <- p2 + coord_flip()

p3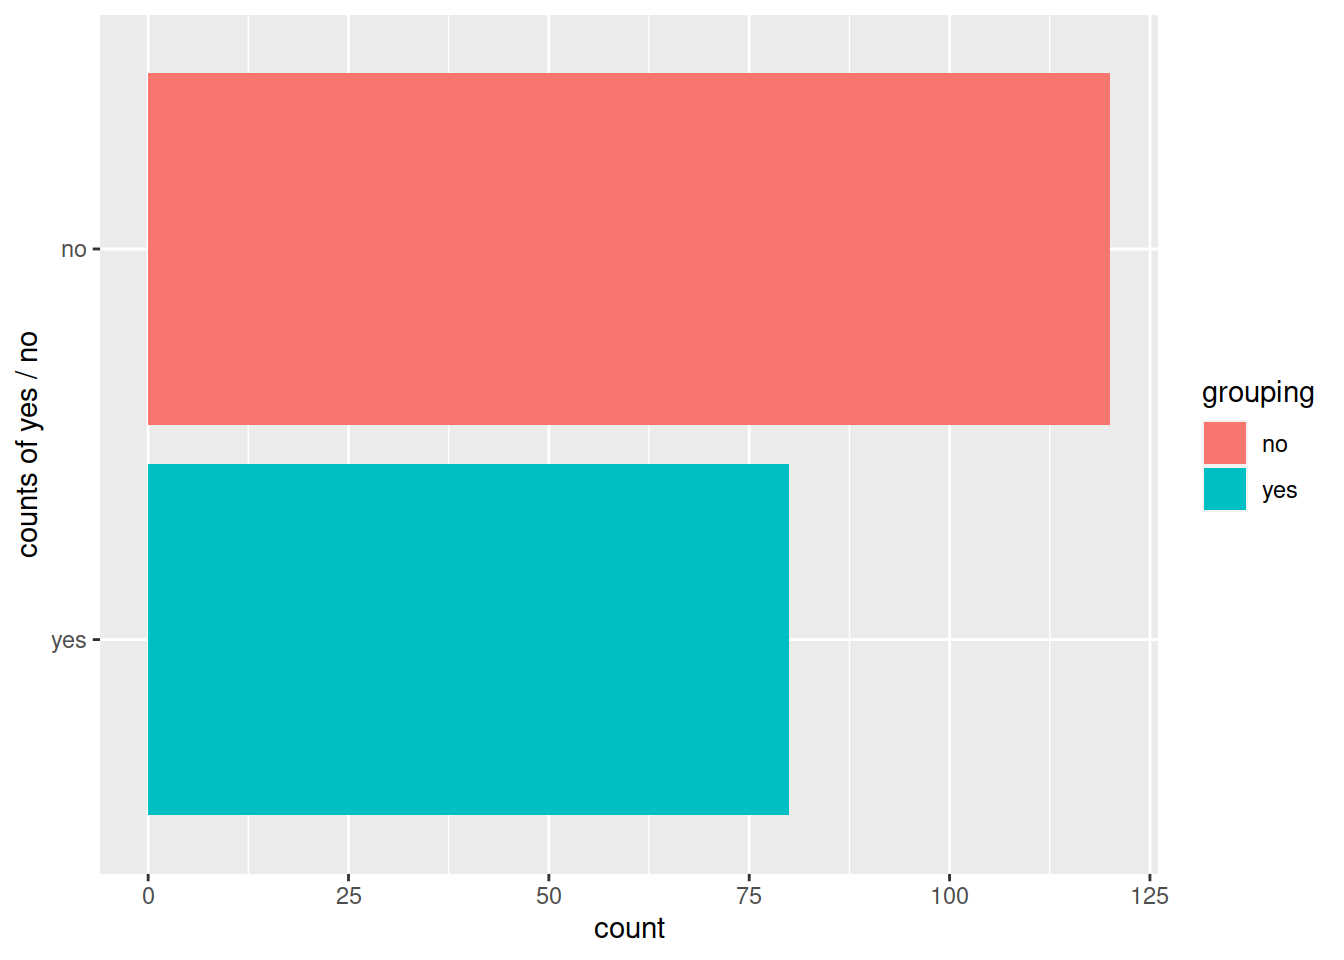
# Change fill
p4 <- p3 + scale_fill_manual(values=c("yellow", "cyan"))

p4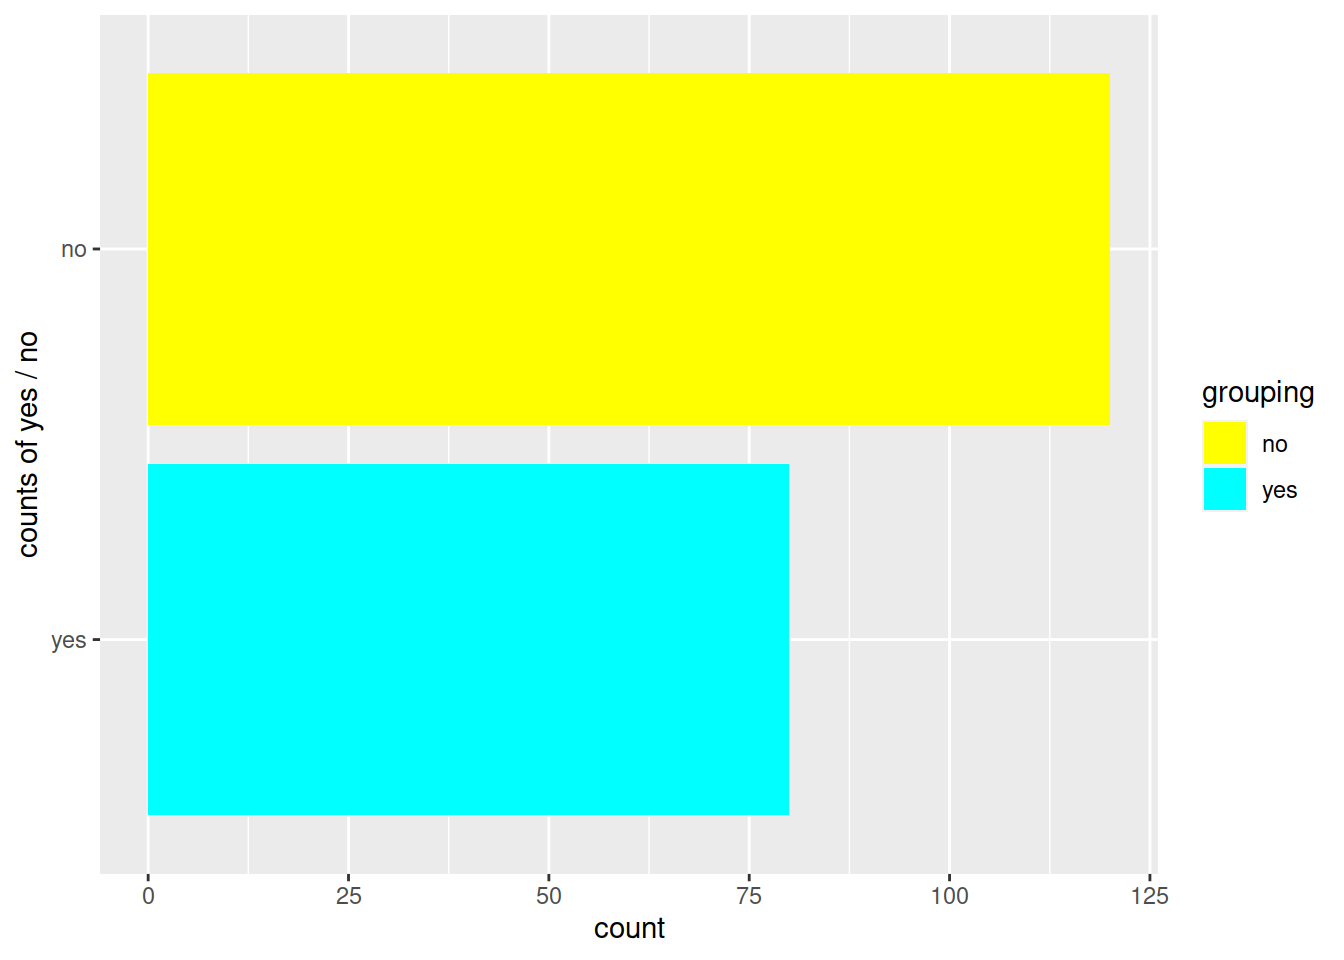
HANDS-ON
Let’s use the chickwts dataset again:
- Create a barplot of the different feed supplements.
- Change the orientation of the x-axis labels (Look it up in this post ).
Answer
# Create a barplot of the different **feed supplements**.
ggplot(data=chickwts, mapping=aes(x=feed)) +
  geom_bar()

# Change the orientation of the x-axis labels
ggplot(data=chickwts, mapping=aes(x=feed)) +
  geom_bar() +
  theme(axis.text.x=element_text(angle=45))
16.4.1 Bar plots with error bars
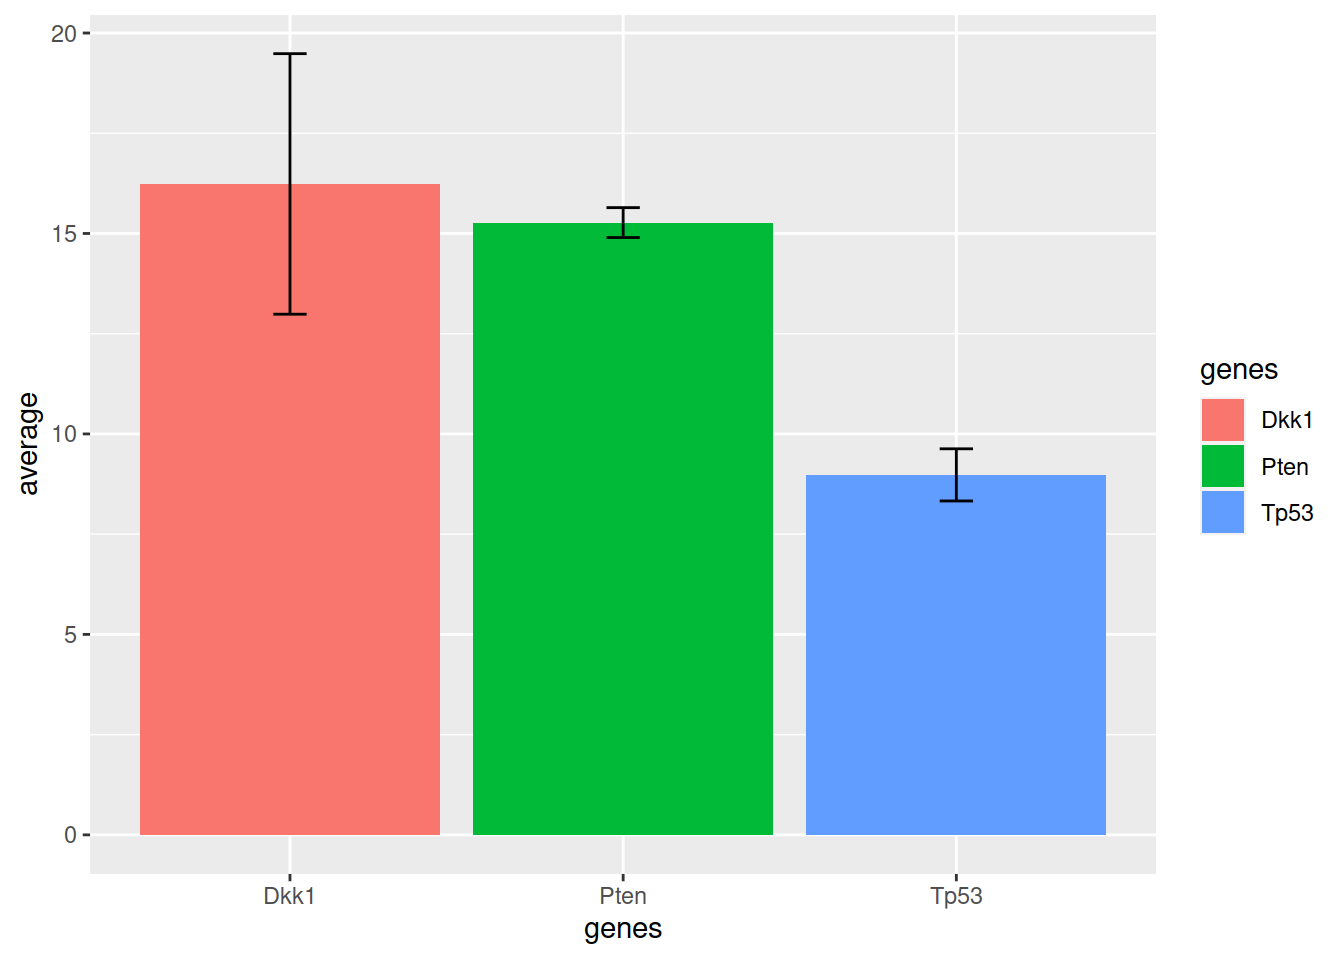
We can create error bars on barplots.
Let’s create a toy data set, that contains 7 independent qPCR measurements for 3 genes:
pcr <- data.frame(Dkk1=c(18.2, 18.1, 17.8, 17.85, 18.6, 12.4, 10.7),
                  Pten=c(15.1,15.2, 15.0, 15.6, 15.3, 14.8, 15.9),
                  Tp53=c(9.1, 9.9, 9.25, 8.7, 8.8, 9.3, 7.8))
The height of the bar will represent the average qPCR measurement. The error bar will represent the average - standard deviation on the lowe part, and the average + standard deviation on the high part.
We need to create a data frame that summarizes these values:
pcr_summary <- data.frame(average=apply(pcr, 2, mean),
                          standard_deviation=apply(pcr, 2, sd),
                          genes=colnames(pcr))
And now we can plot!
ggplot(pcr_summary, aes(x=genes, y=average, fill=genes)) +
  geom_bar(stat = "identity") +
  geom_errorbar(aes(ymin=average-standard_deviation, ymax=average+standard_deviation), colour="black", width=.1)