15.2 venn.diagram function from VennDiagram package
A Venn diagram shows all possible logical relations between data sets.
The venn.diagram function from the VennDiagram package allows to create up to a 5-way Venn Diagram (i.e. 5 circles representing 5 data sets).
# load package
library(VennDiagram)

# Prepare character vectors
v1 <- c("DKK1", "NPC1", "NAPG", "ERG", "VHL", "BTD", "MALL", "HAUS1")
v2 <- c("SMAD4", "DKK1", "ASXL3", "ERG", "CKLF", "TIAM1", "VHL", "BTD", "EMP1", "MALL", "PAX3")
v3 <- c("PAX3", "SMAD4", "DKK1", "MALL", "ERG", "CDKN2A", "DENR", "NPC1", "NAPG")

# Create a list of vectors
vlist <- list(v1, v2, v3)
names(vlist) <- c("list1", "list2", "list3")

# 2-way Venn
venn.diagram(vlist[1:2],
    filename="Venn_2way.png",
    imagetype="png")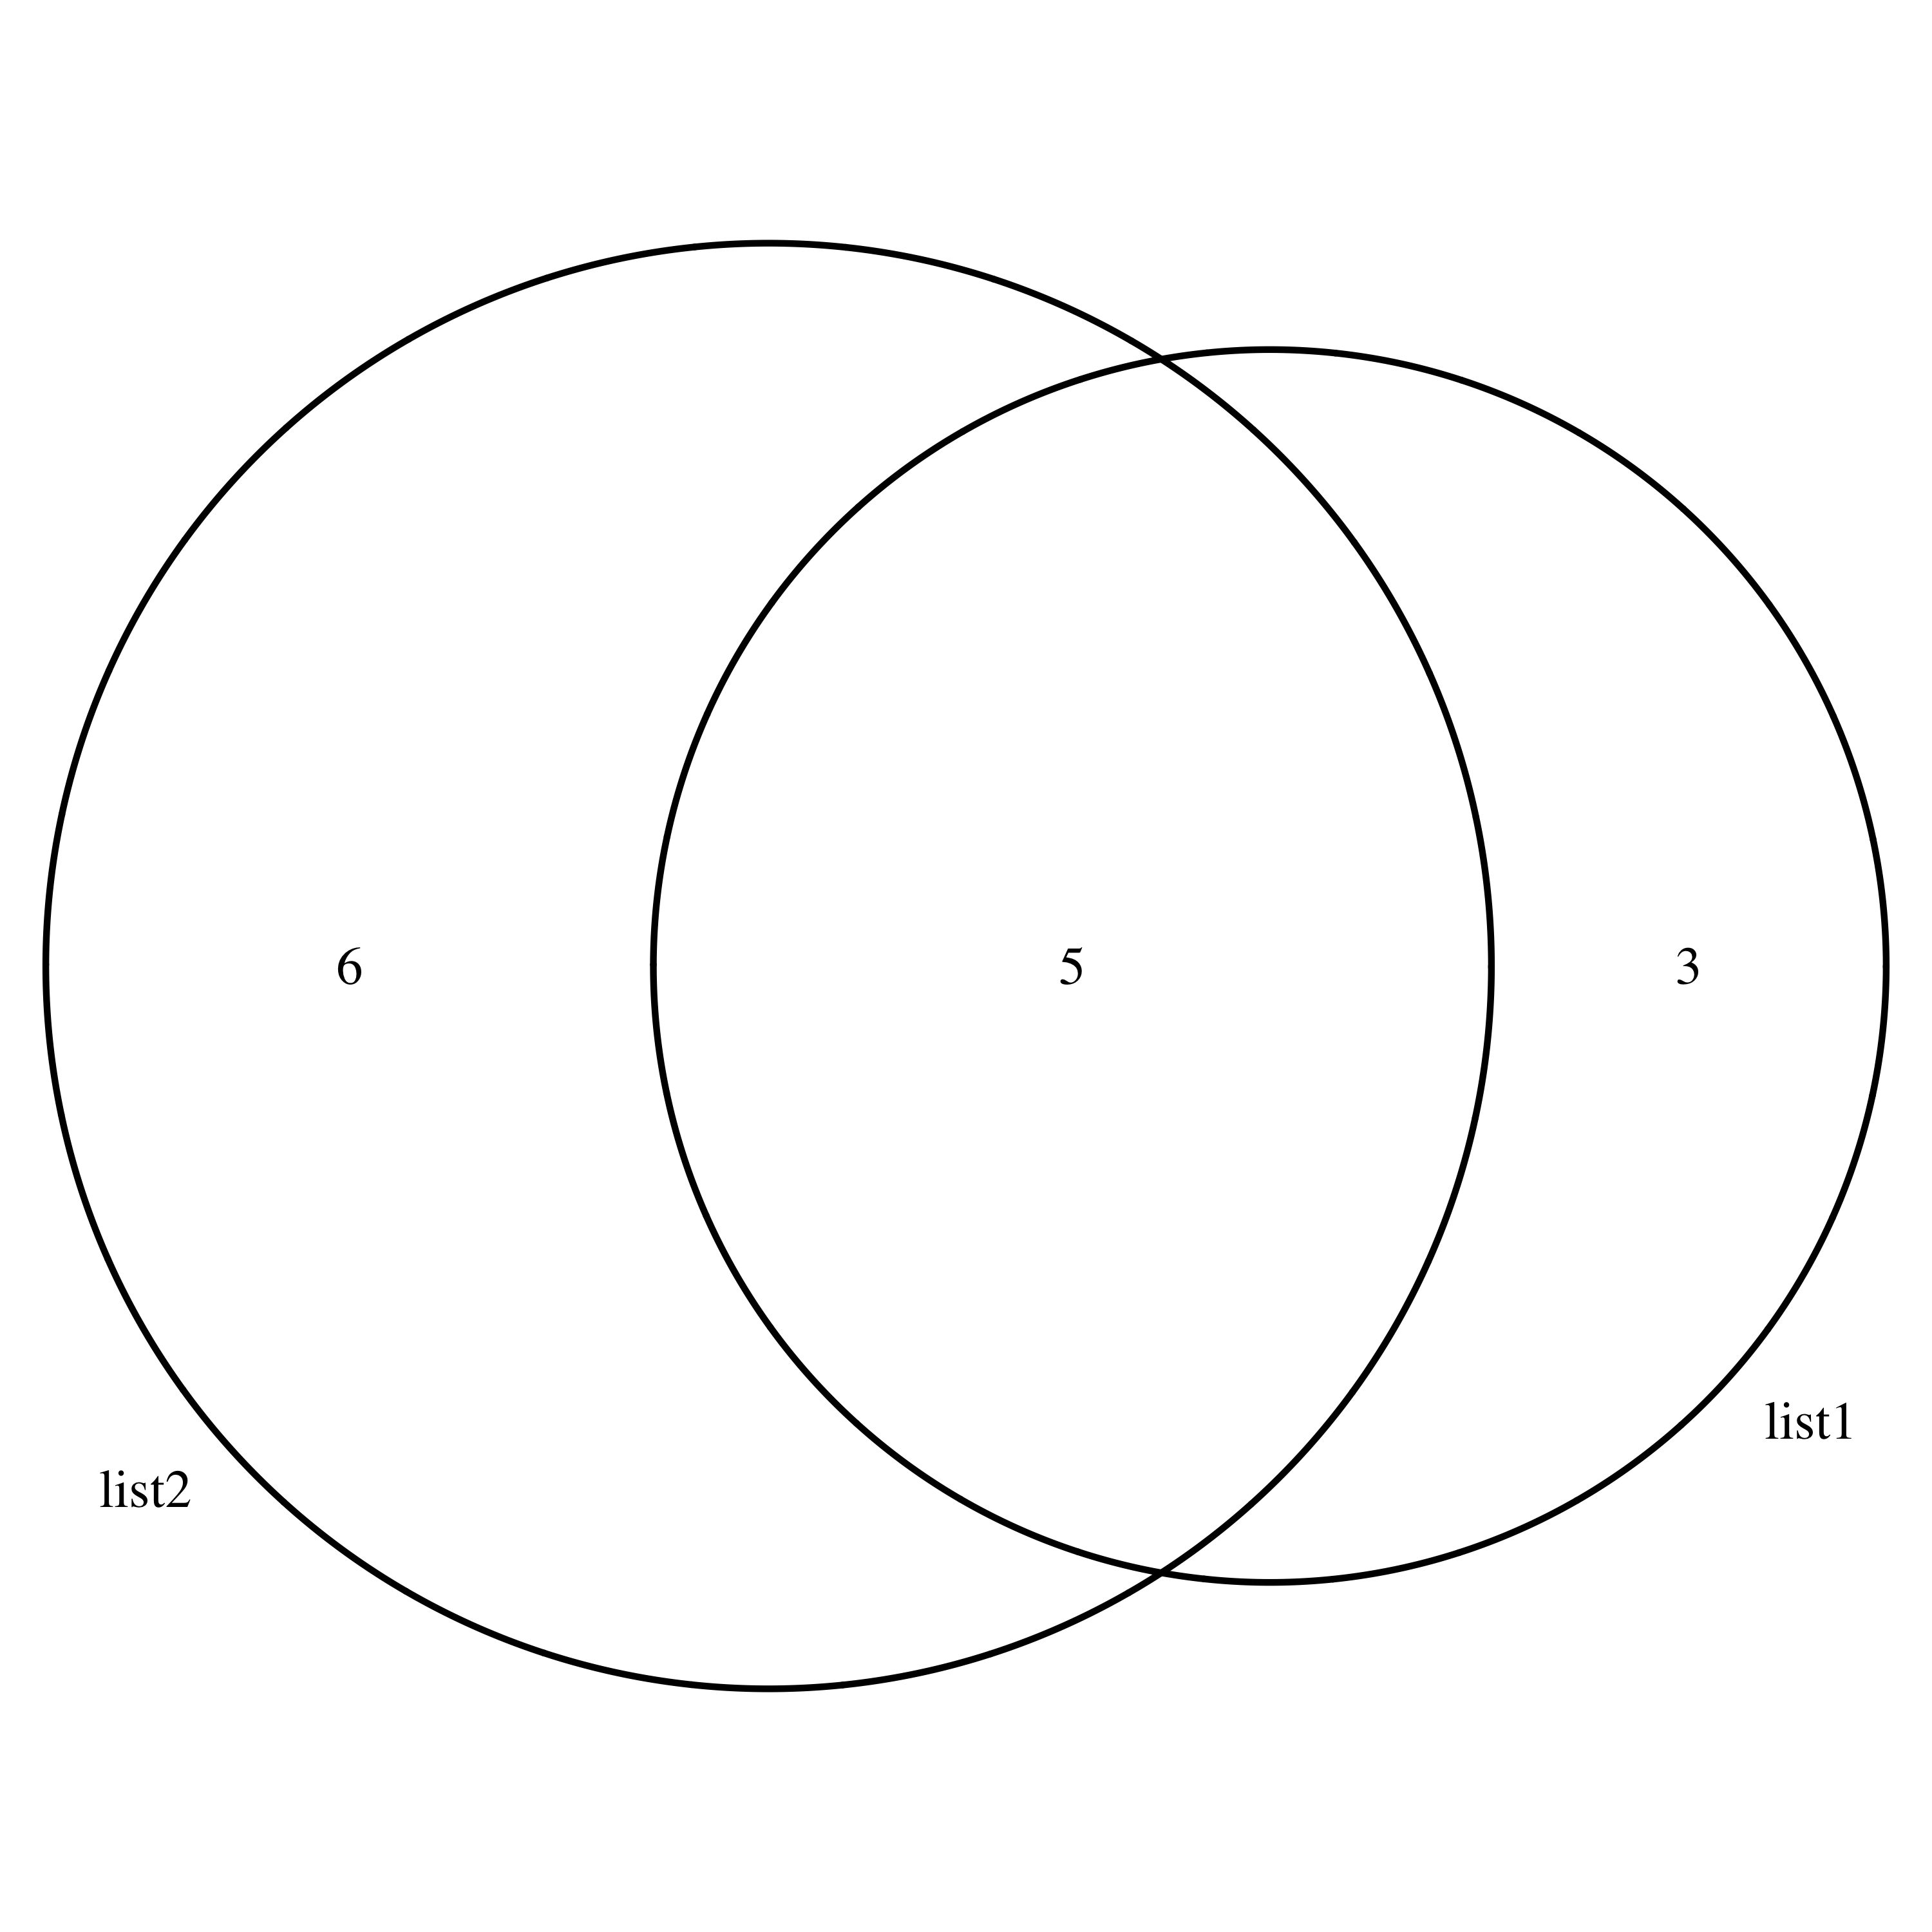
# 3-way Venn
venn.diagram(vlist,
        filename="Venn_3way.png",
        imagetype="png")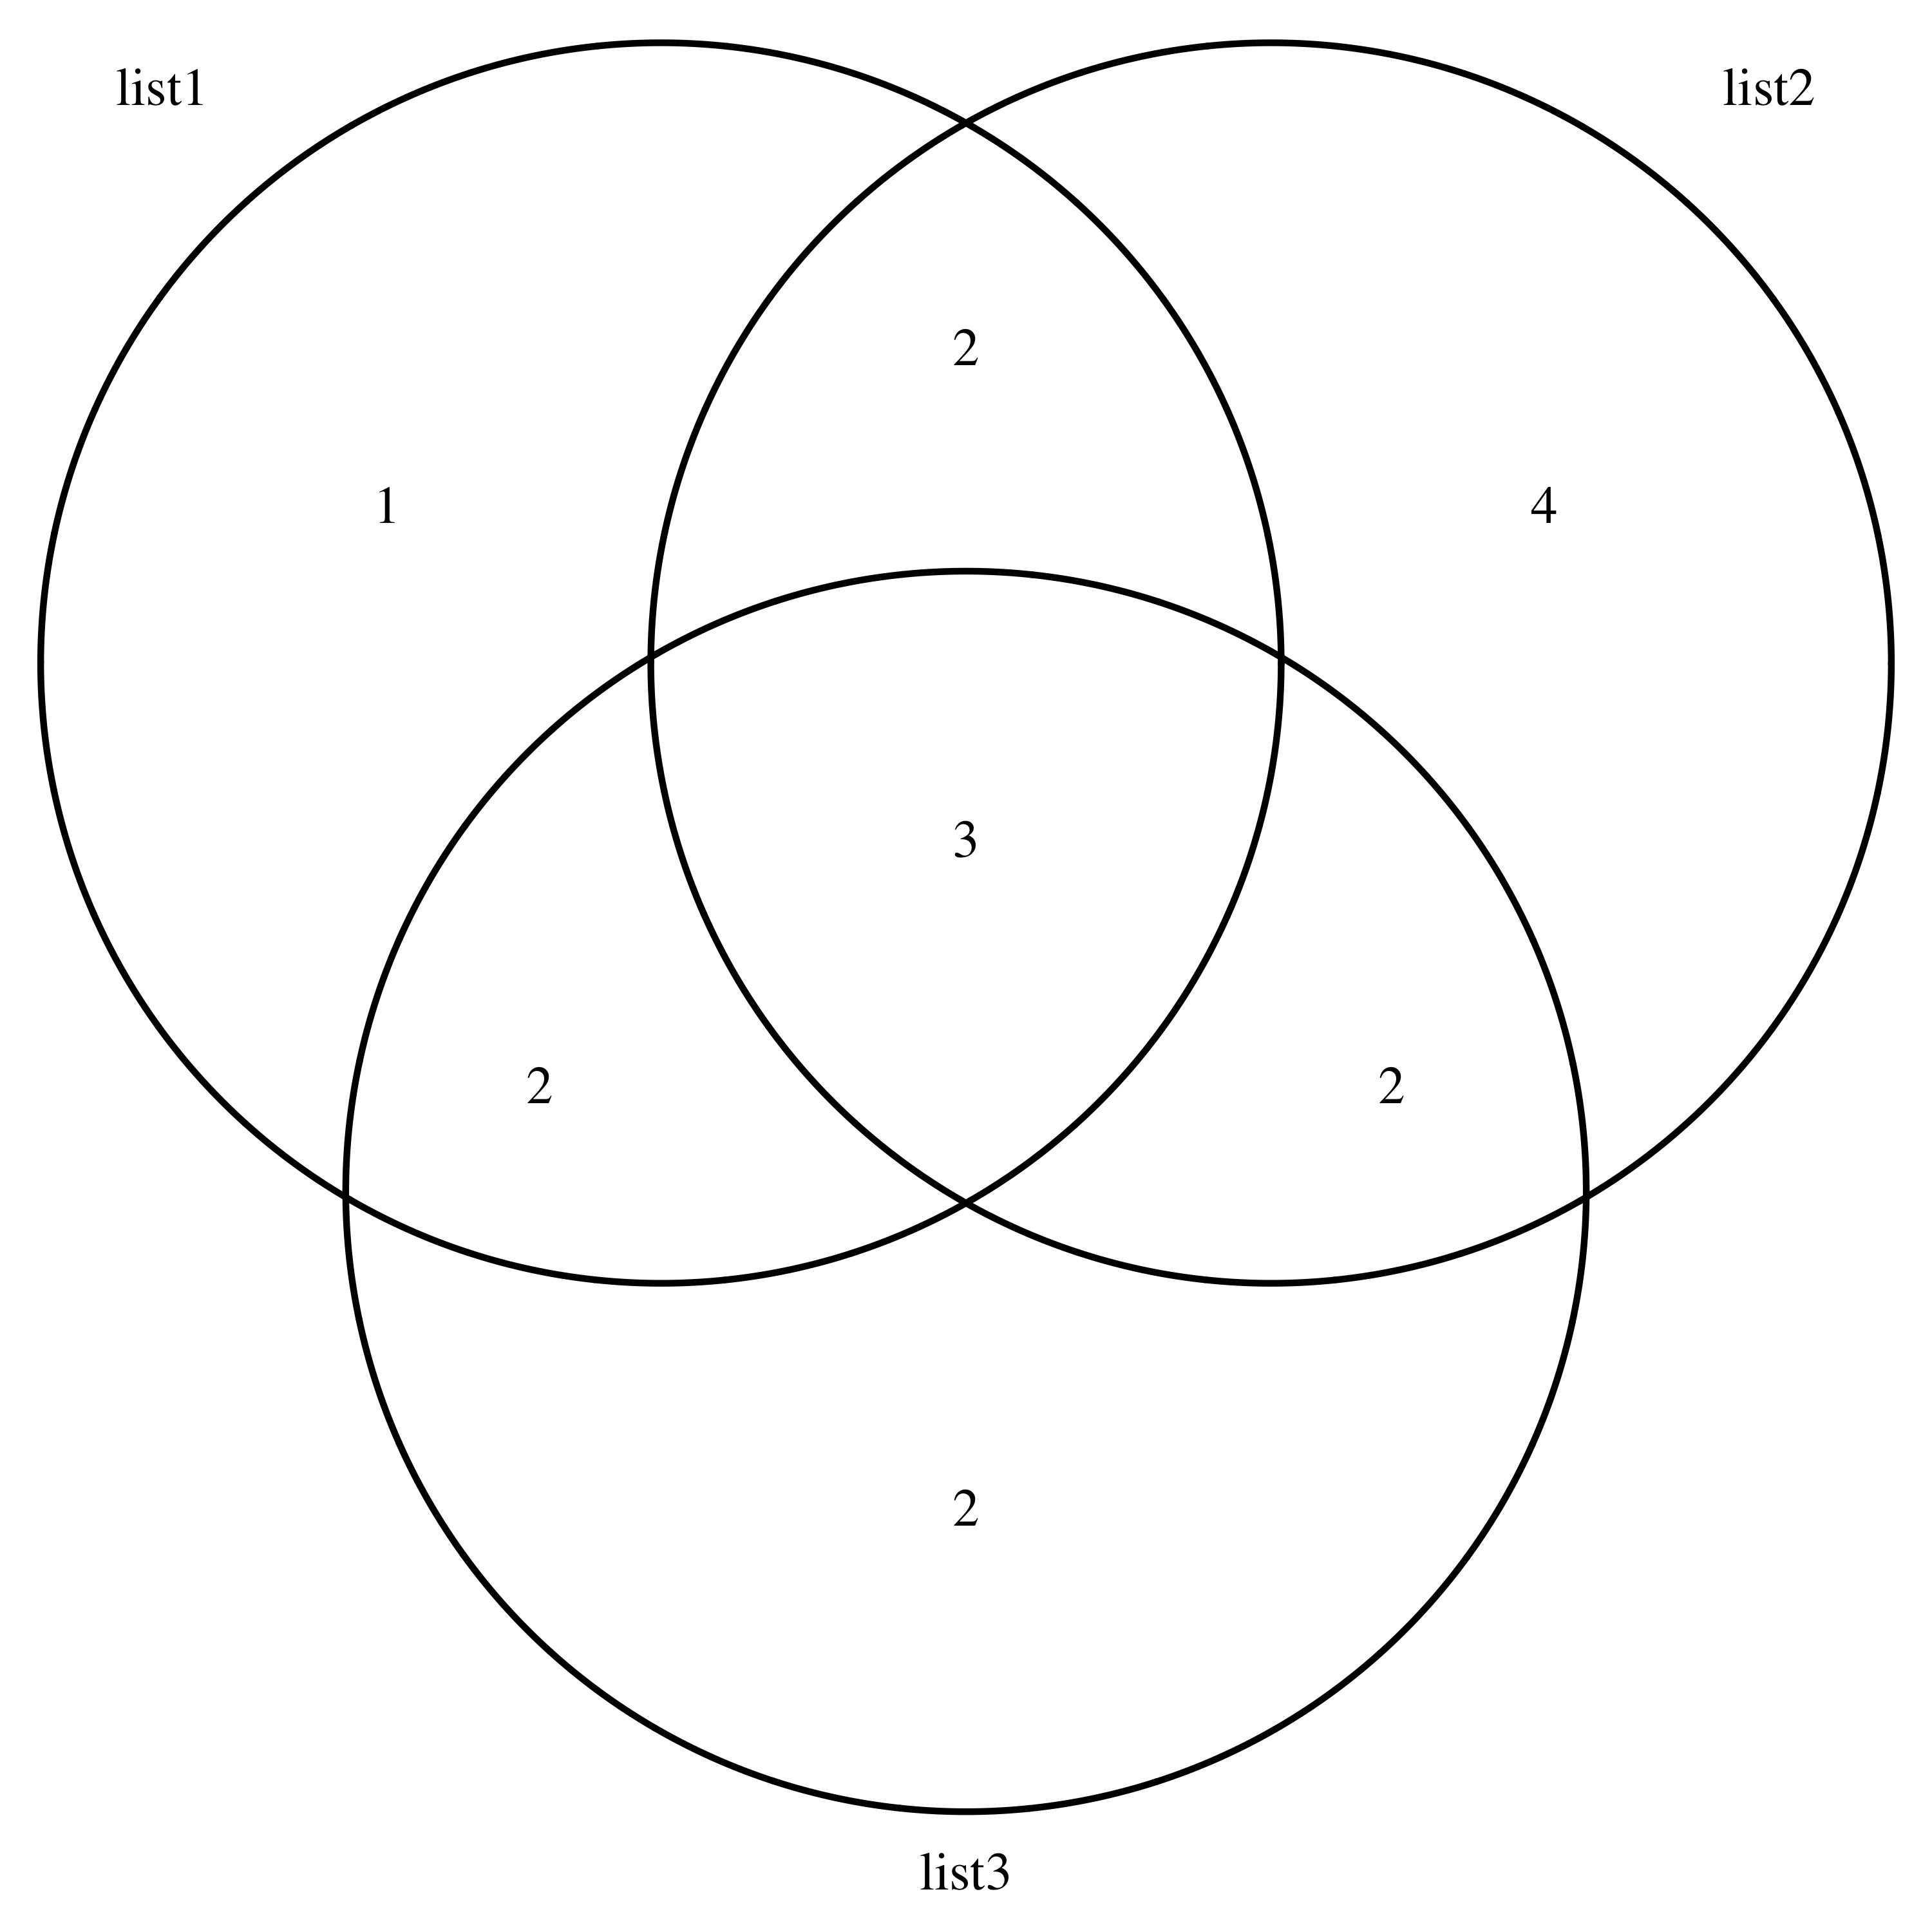
- More arguments:
- main : title
- sub : sub-title
- main.col : color of title font
- fill : color of circles
- col : color of circle lines
- cat.col : color of category labels
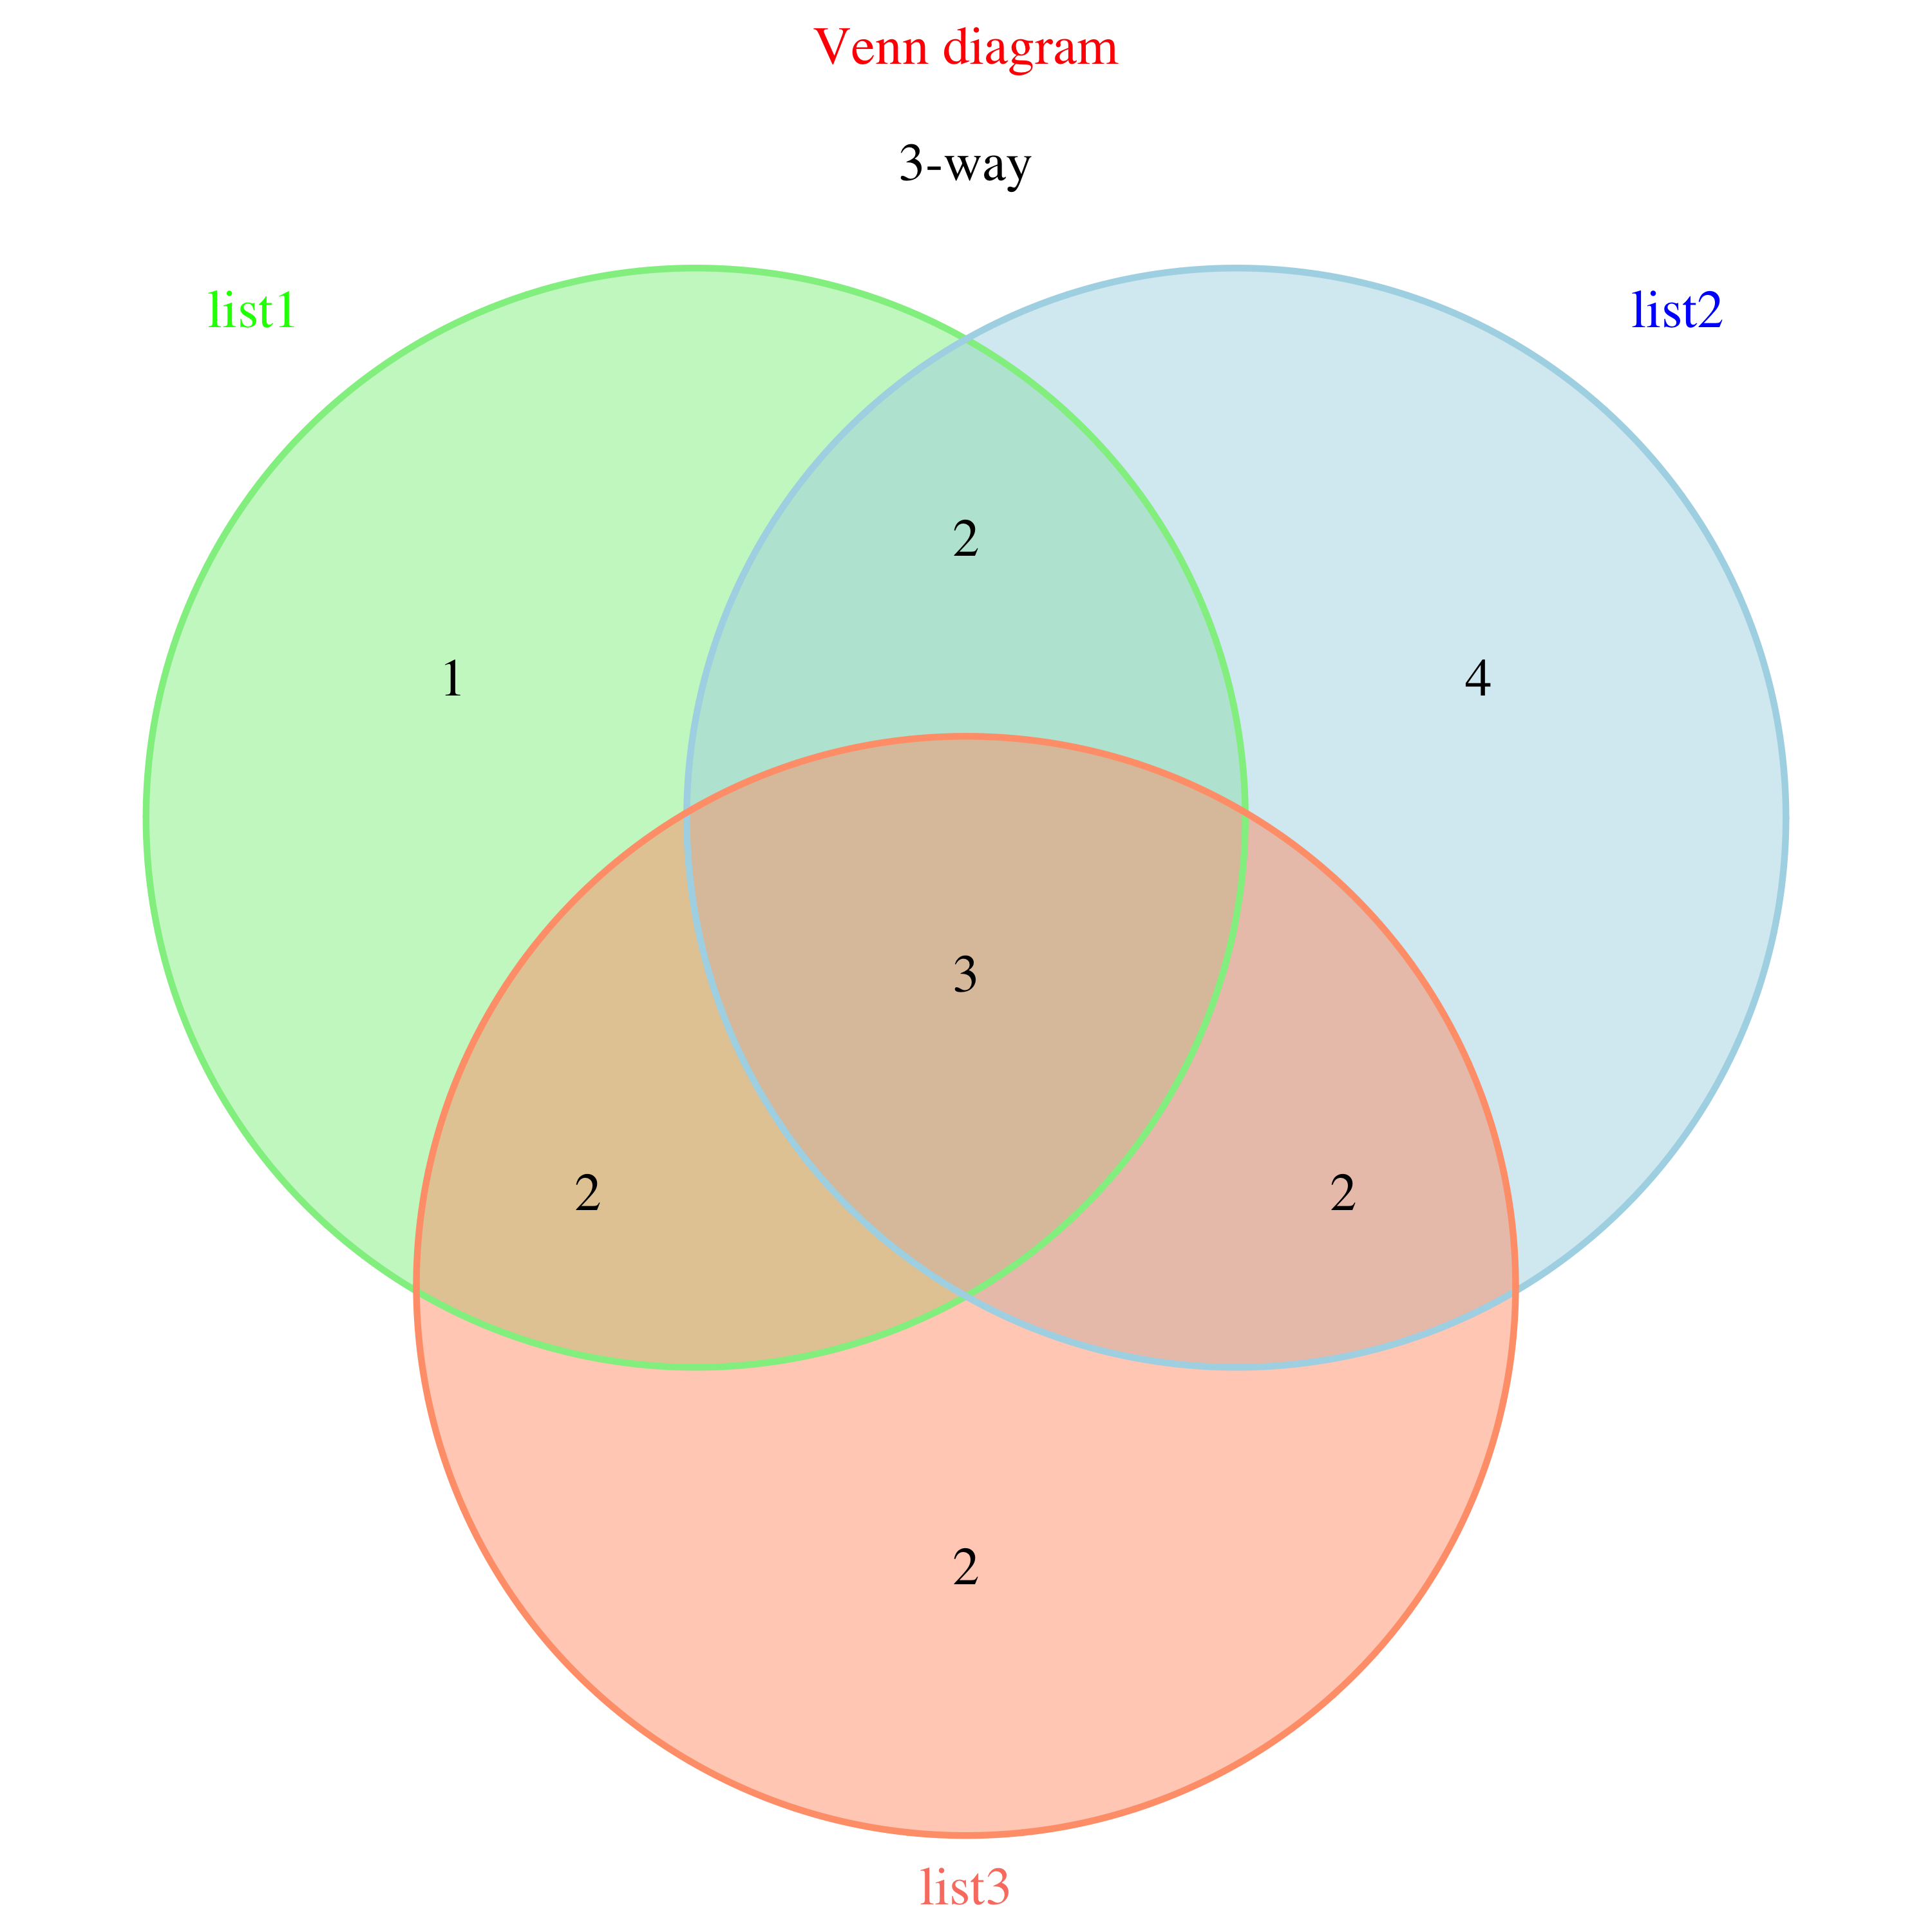
venn.diagram(vlist,
        filename="Venn_3way_more.png",
        imagetype="png",
    main="Venn diagram",
    sub="3-way",
    main.col="red",
    fill=c("lightgreen", "lightblue", "lightsalmon"),
    col=c("lightgreen", "lightblue", "lightsalmon"),
    cat.col=c("green", "blue", "salmon"))