16.7 Saving plots in files
- The same as for regular plots applies:
png("myggplot.png")
p
dev.off()- You can also use the ggplot2 ggsave function:
# By default, save the last plot that was produced
ggsave(filename="lastplot.png")

# You can pick which plot you want to save:
ggsave(filename="myplot.png", plot=p)

# Many different formats are available:
  # "eps", "ps", "tex", "pdf", "jpeg", "tiff", "png", "bmp", "svg", "wmf"
ggsave(filename="myplot.ps", plot=p, device="ps")

# Change the height and width (and their unit):
ggsave(filename="myplot.pdf",
  width = 20,
  height = 20,
units = "cm")- You can also organize several plots on one page
- One way is to use the gridExtra package:
- ncol, nrow: arrange plots in such number of columns and rows
install.packages("gridExtra")# load package
library(gridExtra)
# 2 rows and 2 columns
grid.arrange(pscat, pbox_fill, pbar, phist, nrow=2, ncol=2)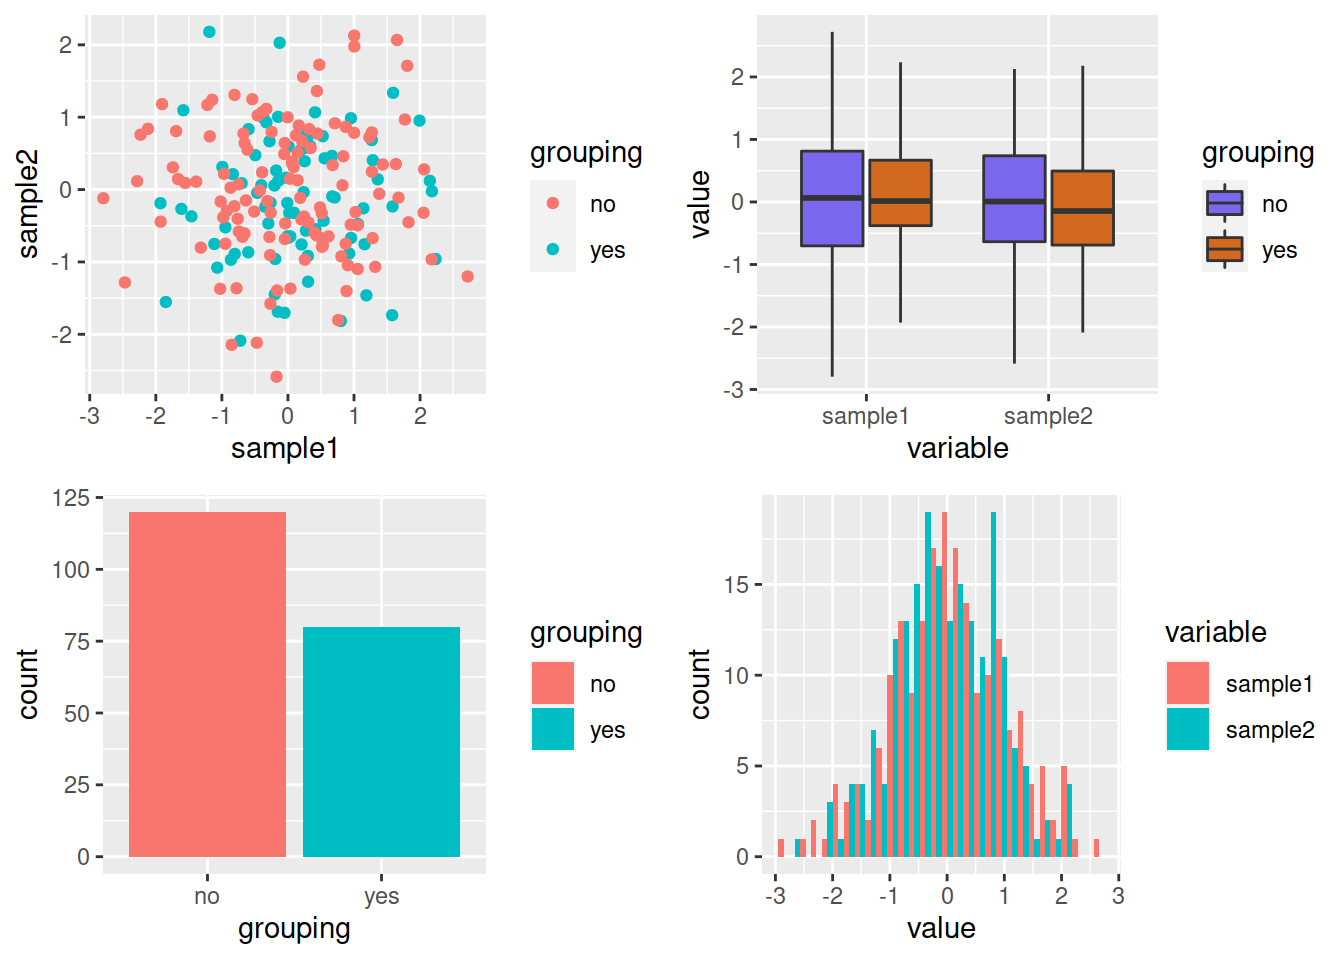
# 1 row and 4 columns
grid.arrange(pscat, pbox_fill, pbar, phist, nrow=1, ncol=4)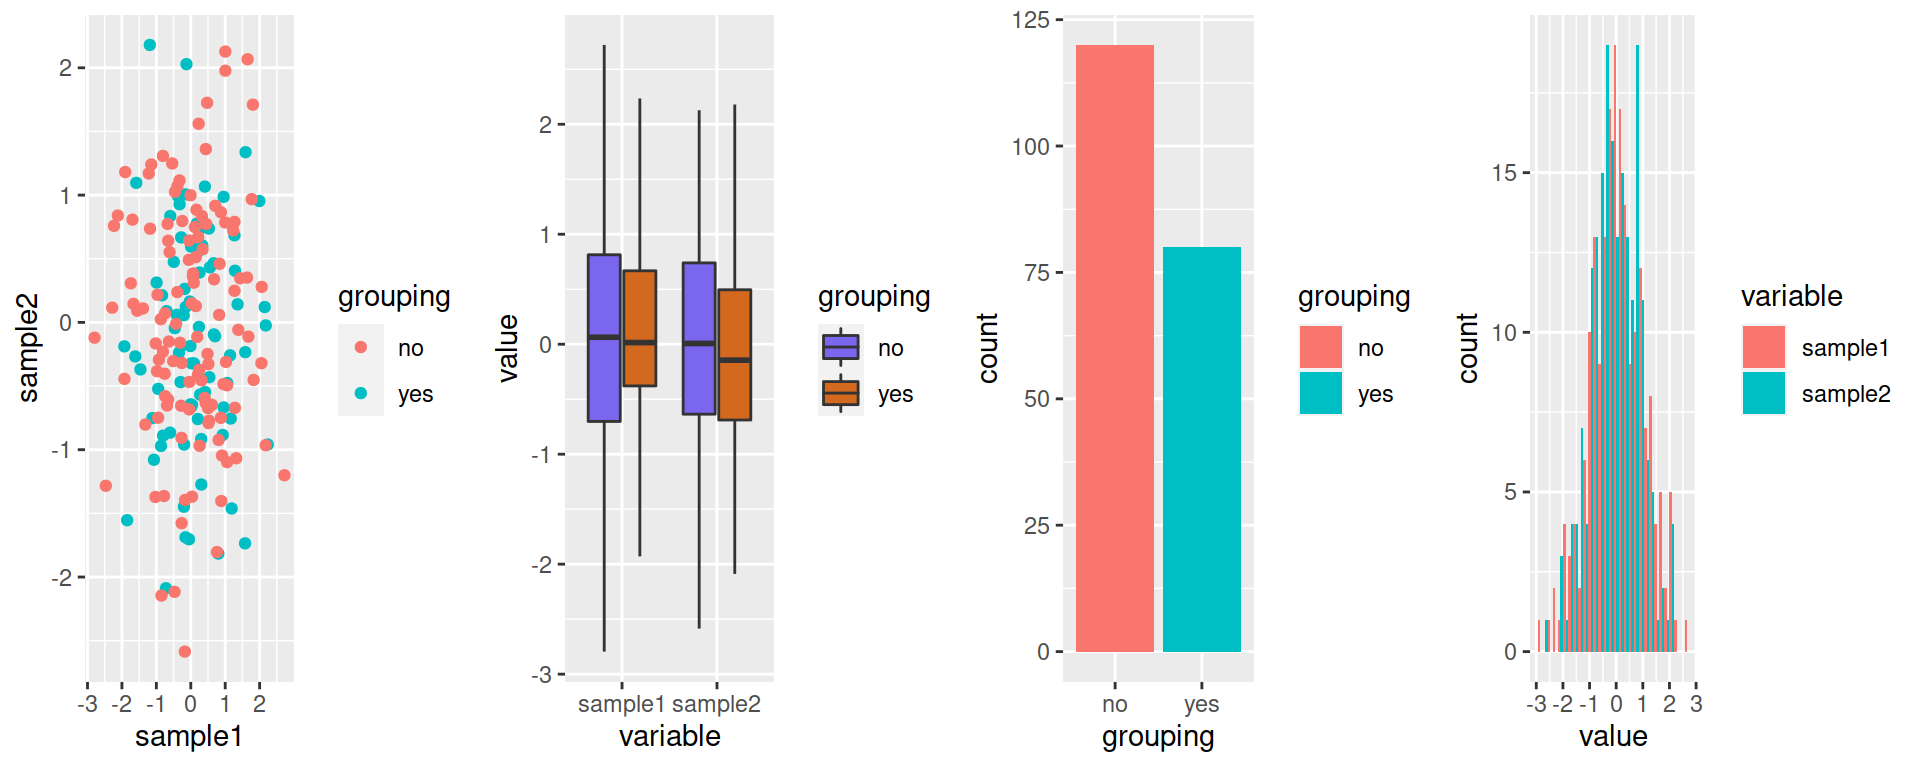
Combine ggsave and grid.arrange:
myplots <- grid.arrange(pscat, pbox_fill, pbar, phist, nrow=1, ncol=4)

ggsave(filename="mygridarrange.png", plot=myplots)
HANDS-ON (same as for the “base” plots!)
Go back to the previous plots you created (if you didn’t save commands in an R script, you can refer to the History tab in the top-right panel):
- Save 1 plot of your choice in a jpeg file.
- Save 3 plots of your choice in a pdf file (one plot per page).
- Organize the same 3 plots in 1 row / 3 columns. Save the image in a png file. Play with the width (and perhaps also height) argument of
png()until you are satisfied with the way the plot renders.
Answer
# Save 1 plot of your choice in a **jpeg** file.
phisto <- ggplot(data=df_long, mapping=aes(x=value)) + geom_histogram()
ggsave(filename="mygridarrange.jpeg", plot=phisto)
# Save 3 plots of your choice in a **pdf** file (one plot per page).
pbarplot <- ggplot(data=chickwts, mapping=aes(x=feed)) + geom_bar()
pboxplot <- ggplot(data=CO2, mapping=aes(x=Treatment, y=uptake, fill=Type)) + geom_boxplot()
pdf("my3ggplot2.pdf")
phisto
pbarplot
pboxplot
dev.off()
# Organize the same 3 plots in 1 row / 3 columns.
my3ggplots <- grid.arrange(phisto, pbarplot, pboxplot, nrow=1, ncol=3)
ggsave(filename="my3ggplots.png", plot=my3ggplots, width=12)