9.7 Two-dimensional structures manipulation
9.7.1 Dimensions
- Get the number of rows and the number of columns:
# Create a data frame
d <- data.frame(c("Maria", "Juan", "Alba"),
    c(23, 25, 31),
    c(TRUE, TRUE, FALSE))
# number of rows
nrow(d)
# number of columns
ncol(d)- Check the dimensions of the object: both number of rows and number of columns:
# first element: number of rows
# second element: number of columns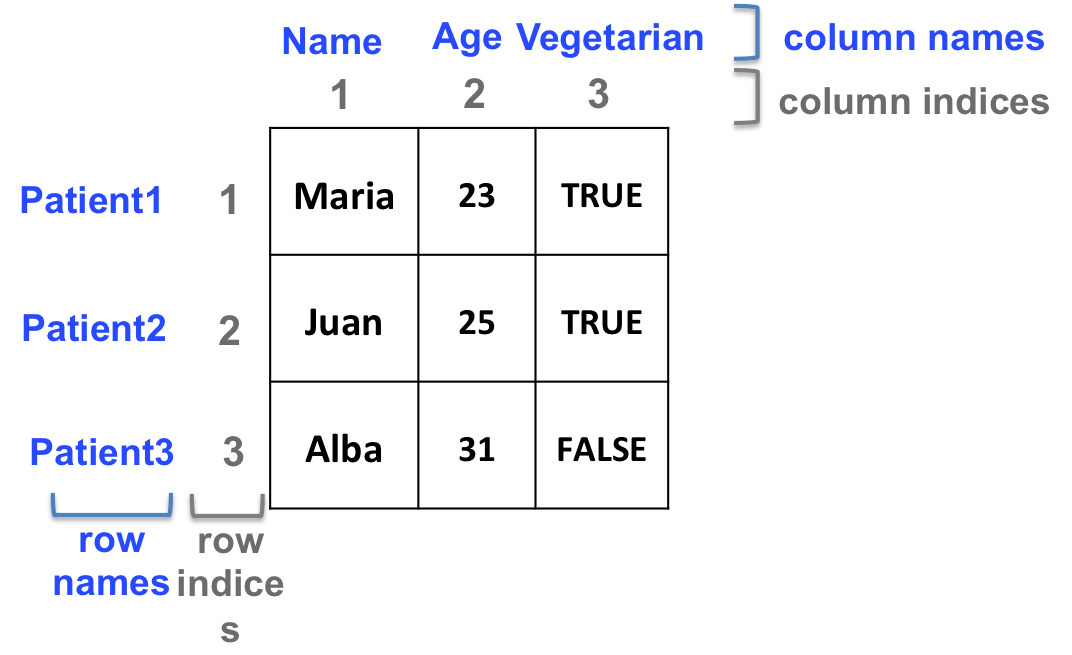
dim(d)- Dimension names
Column and/or row names can be added to matrices and data frames
colnames(d) <- c("Name", "Age", "Vegetarian")
rownames(d) <- c("Patient1", "Patient2", "Patient3")
Column and/or row names can be used to retrieve elements or sets of elements from a 2-dimensional object:
d[,"Name"]
# same as:
d[,1]

d["Patient3", "Age"]
# same as:
d[3,2]

# for data frames ONLY, the $ (dollar) sign can be used to retrieve columns:
d$Name
# is the same as
d[,"Name"]
# and the same as
d[,1]- Include names as you create objects:
- Matrix:
m <- matrix(1:4, ncol=2,
dimnames=list(c("row1", "row2"), c("col1", "col2")))- Data frame:
df <- data.frame(col1=1:2, col2=1:2,
    row.names=c("row1", "row2"))
9.7.2 Manipulation
Same principle as vectors… but in 2 dimensions!
9.7.2.1 Examples
- Select rows of b if at least one element in column 2 is greater than 24 (i.e. select patients if they are older than 24):
# build data frame d
d <- data.frame(Name=c("Maria", "Juan", "Alba"),
        Age=c(23, 25, 31),
        Vegetarian=c(TRUE, TRUE, FALSE))
rownames(d) <- c("Patient1", "Patient2", "Patient3")

# The following commands all output the same result:
d[d[,2] > 24, ]
d[d[,"Age"] > 24, ]
d[d$Age > 24, ]

# Step by step:
# 1. "isolate" column of interest (here, the second column: "Age")
d[,"Age"]
# 2. apply your criterion (here, "Age" should be greater than 24)
d[,"Age"] > 24
# 3. Extract the corresponding rows from the original data frame
d[ d[, "Age"] > 24, ]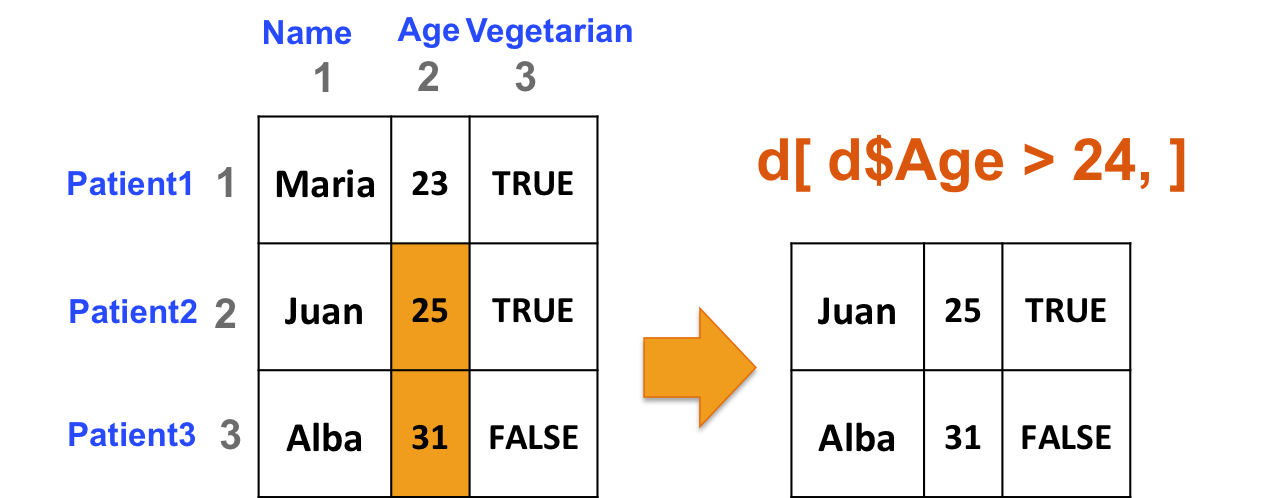
- Select patients (rows) based on 2 criteria: age of the patient (column 2) should be great than or equal to 25, and the patient should be vegetarian (column 3):
d[ d$Age >= 25 & d$Vegetarian == TRUE, ]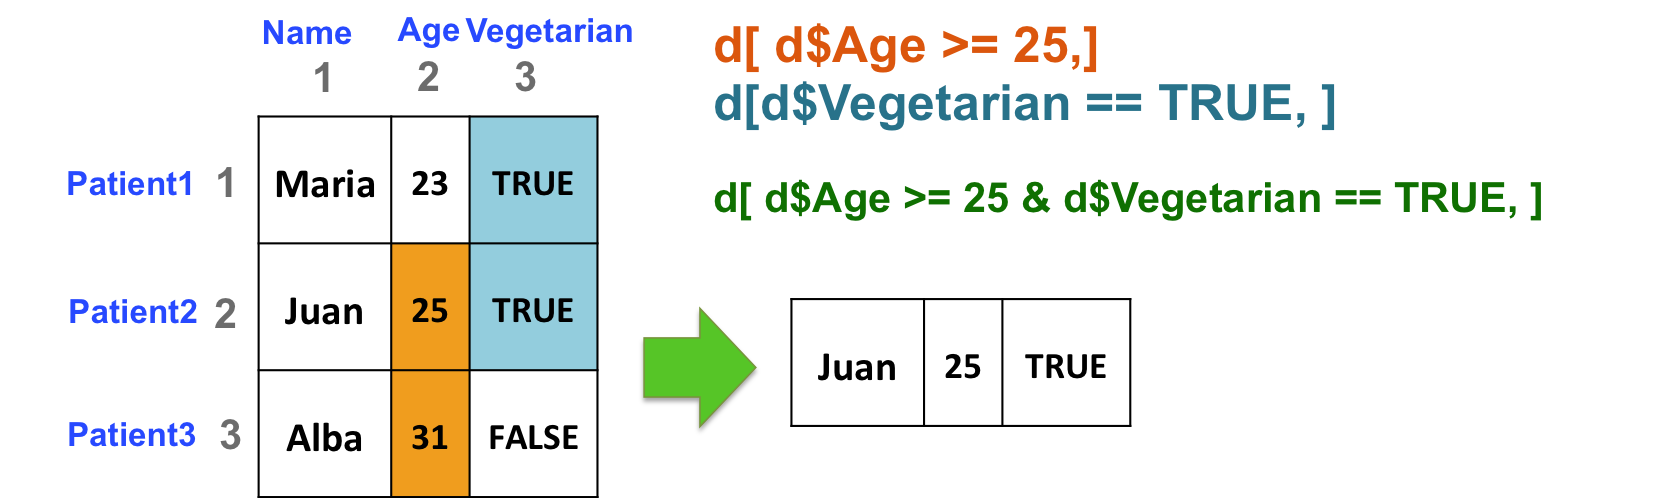
9.7.2.2 Add rows and columns to matrices and data frames
- For matrices: add a row or a column with rbind and cbind, respectively:
# add a column
cbind(d, 1:3)
# add a row
rbind(d, 4:6)- Add columns (variables) to data frames:
# add column "Gender"
dgender <- data.frame(d, Gender=c("F", "M", "F"))- Add rows (observations) to data frames:
As data frames columns can be of different type, rbind will not give the expected results.
Remember str()?
Let’s try to add a patient to our data frame d with rbind, and a new vector:
drb <- rbind(d, c("Jordi", 33, FALSE))
# check the structure
str(drb)
# what is the problem here?
Add a patient to d using data.frame: need to use an intermediate data frame, and not a vector:
# intermediate data frame
newd <- data.frame("Jordi", 33, FALSE)
# name the intermediate data frames columns the same as d's names
colnames(newd) <- colnames(d)
# add row with rbind
ddf <- rbind(d, newd)
# check the structure
str(ddf)
9.7.2.3 Process the sum of all rows or all columns with rowSums and colSums, respectively.
# create a matrix
b <- matrix(1:20, ncol=4)
# process sum of rows and sum of cols
rowSums(b)
colSums(b)
9.7.2.4 Check the first and last rows with head and tail:
# create a 5000 row matrix
bigmat <- matrix(1:20000, ncol=4)
# check the first and last 6 rows (by default)
head(bigmat)
tail(bigmat)
# check the first and last 10 rows
head(bigmat, n=10)
tail(bigmat, n=10)
HANDS-ON
Given the following data frame mypatients:
mypatients <- data.frame(Name=c("Maria", "Juan", "Alba", "Luis", "Hector"),
        Age=c(23, 25, 31, 18, 42),
        Weight=c(65, 72, 58, 78, 82),
Vegetarian=c(TRUE, TRUE, FALSE, FALSE, TRUE))- What is the average age of vegetarian patients?
- Add a “Gender” column to mypatients (that contains “Female” and “Male” entries).
- What is the average weight of vegetarian men?
9.7.2.5 The apply function
Powerful tool to apply a command to all rows or all columns of a data frame or a matrix.
For example, instead of calculating the sum of each row, you might be interested in calculating the median ? But rowMedians doesn’t exist !
apply takes 3 arguments:
- first argument X: 2-dimensional object
- second argument MARGIN: apply by row or by column?
- 1: by row
- 2: by column
- third argument FUN: function to apply to either rows or columns
# median value of each row of b
apply(X=b, MARGIN=1, FUN=median)
# median value of each column of b
apply(X=b, MARGIN=2, FUN=median)
NOTE: apply is part of a family of functions. For more information, check the dedicated DataCamp chapter.
HANDS-ON
Given the following matrix datam:
# rnorm produces random numbers (here, 10000), from the normal distribution.
# you can set the "seed" so as to be able to exactly reproduce the random selection of numbers:
set.seed(43)
datam <- matrix(rnorm(10000), ncol=25)- How many rows does datam have?
- Calculate the standard deviation of each column of datam (use apply and sd).
- Calculate the median of each row of datam (use apply and median).
9.7.2.6 Select rows or columns based on a pattern
Here we introduce the grep function, that can help you select rows and columns based on patterns.
# example data frame
dfgrep <- data.frame(genes=c("CCNA1", "TP53", "CCND1", "CCNF", "A2M", "PARP2", "TP63", "DKK1"),
                     log2FC_1=c(-2, -1, 0.5, 1.2, -5, 3.2, 1.3, 0.5),
                     pvalue_1=c(0.01, 0.4, 1, 0.9, 0.003, 0.96, 0.002, 0.67),
                     log2FC_2=c(0.1, -2, 3.5, -1.3, 1.5, 2, 2.1, -0.05),
pvalue_2=c(0.87, 0.06, 0.001, 0.4, 0.8, 0.76, 0.08, 0.99))- Select the “pvalue” columns of dfgrep with grep:
# select the columns which names match "pvalue" (it does NOT have to be an exact match):
grep(pattern="pvalue", x=colnames(dfgrep))
# extract only those columns:
dfgrep[, grep(pattern="pvalue", x=colnames(dfgrep))]- Select all tumor protein gene (TP genes) rows with grep:
dfgrep[grep(pattern="TP", x=dfgrep$genes), ]For more details about grep and pattern selection, you can refer to the dedicated extra section
- Useful grep arguments:
Show the selected names (not the indices):
# shows the indices of selected elements, by default:
grep(pattern="TP", x=dfgrep$genes)
# shows the actual selected elements
grep(pattern="TP", x=dfgrep$genes, value=TRUE)
Show what does NOT match:
# shows what matches the search:
grep(pattern="TP", x=dfgrep$genes)
# shows what doesn't match the search:
grep(pattern="TP", x=dfgrep$genes, invert=TRUE)
HANDS-ON
Let’s take the dfgrep data frame again:
- What is the average “log2FC_1” and “log2FC_2” of the cyclin genes (CCN symbols)? Proceed this way:
- Select all CCN gene rows.
- Select all “log2FC” columns.
- Using the apply function, calculate the average of each “logFC” columns.