13.5 Histograms
A histogram graphically summarizes the distribution of the data.
- A simple histogram
# Vector of 200 random values from the normal distribution
hist200 <- rnorm(200)

# Plot histogram
hist(x=hist200)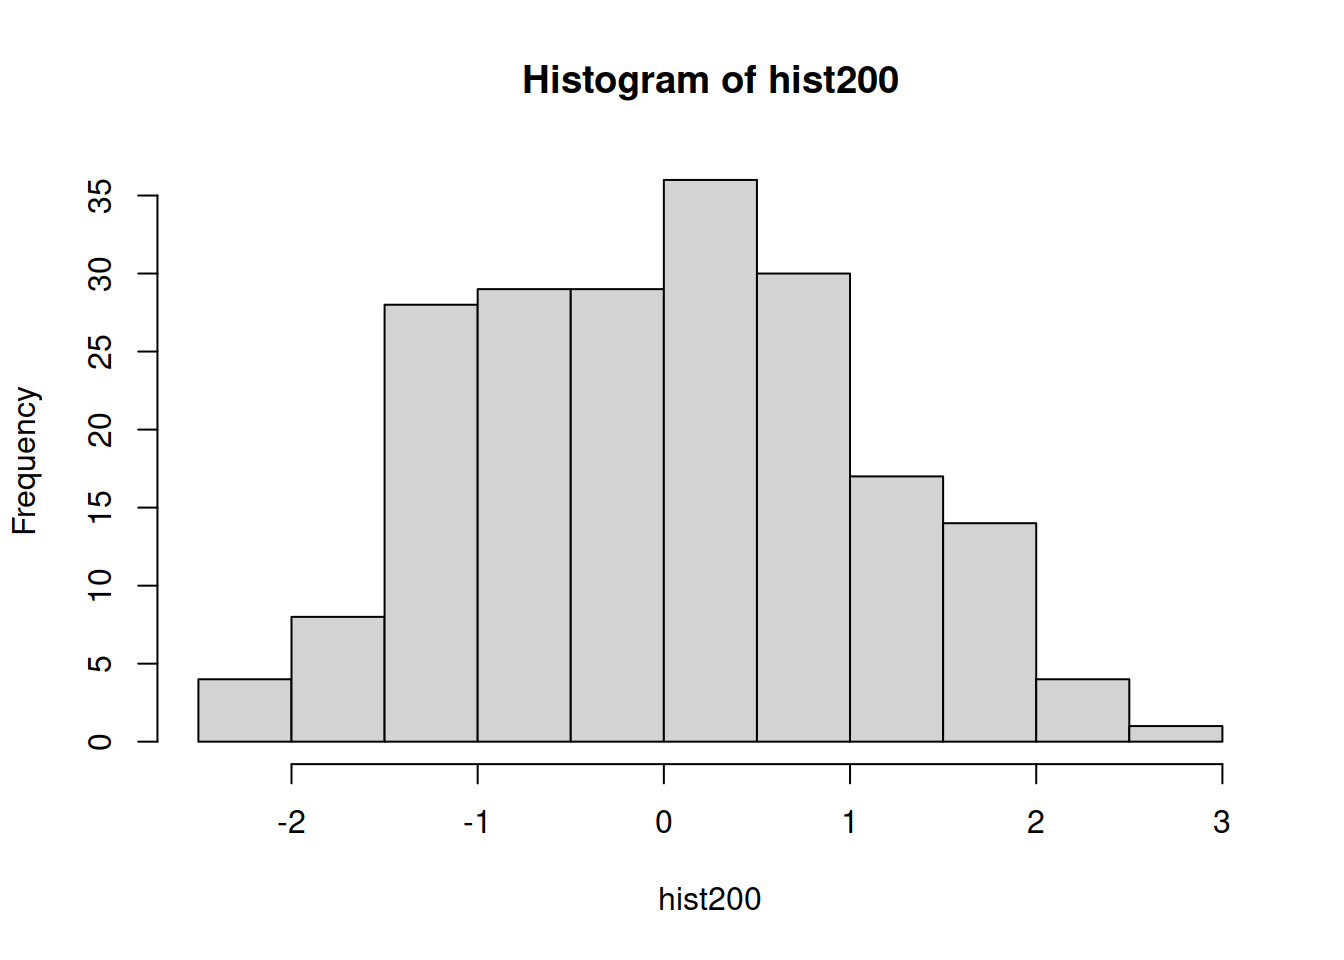
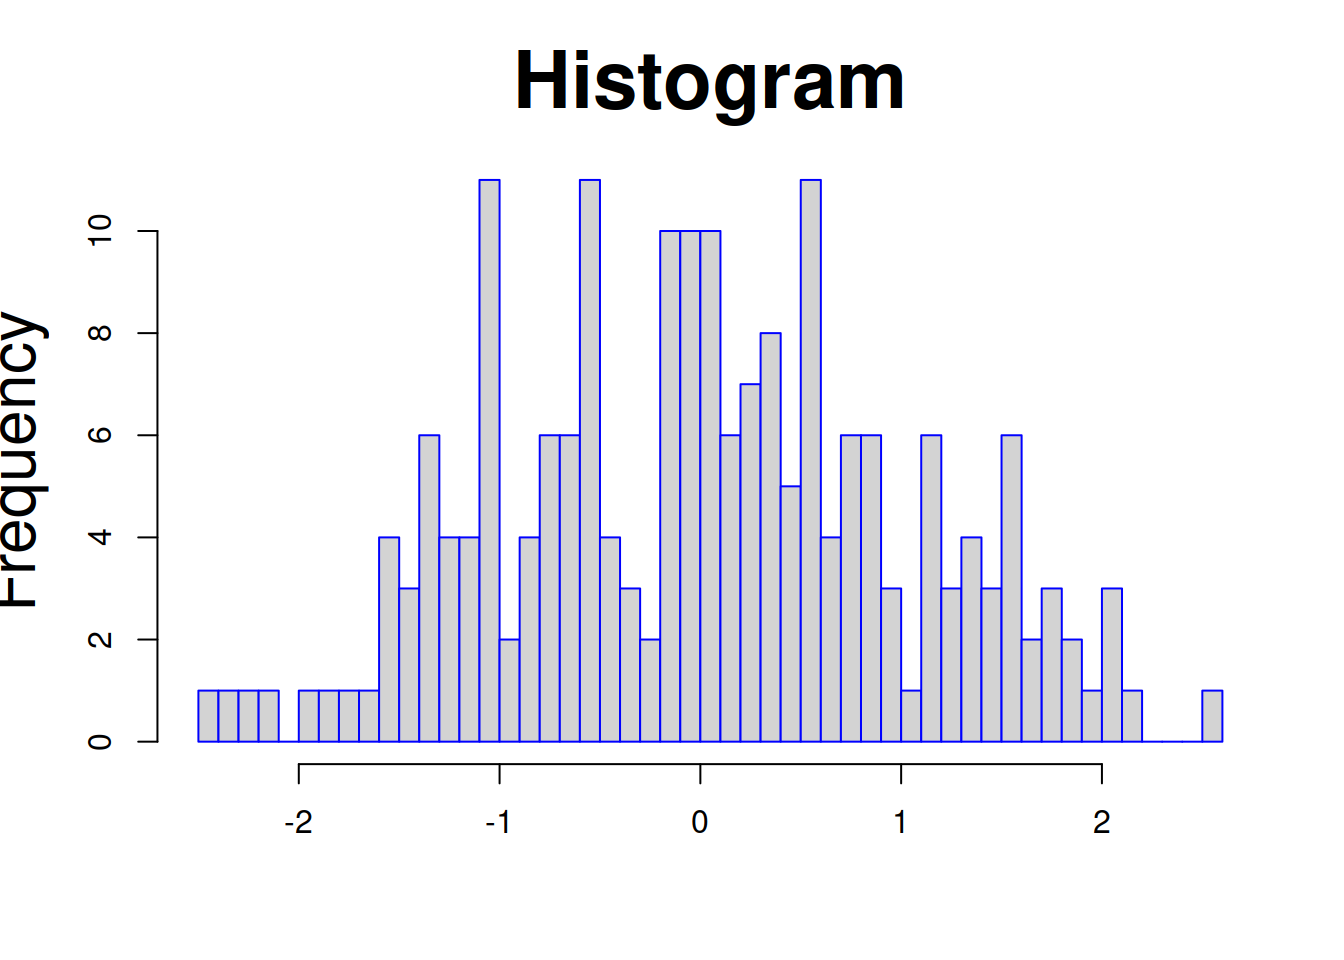
- Add parameters:
- border: color of bar borders
- breaks: number of bars the data is divided into
- cex.main: size of title
- cex.lab: size of axis labels
hist(x=hist200,
    border="blue",
    breaks=50,
    main="Histogram",
    xlab="",
    cex.main=2.5,
    cex.lab=2)