16.9 More about the theme() function
The theme() allows a precise control of graphical parameters such as axis text, ticks and labels, or legend texts and labels, etc.
More details here
# Let's the project_long object from exercise 12, and plot boxplots
boxp <- ggplot(data=project_long, aes(x=variable, y=value, color=expr_limits)) +
  geom_boxplot()

# Remove the legend title:
boxp + theme(legend.title=element_blank())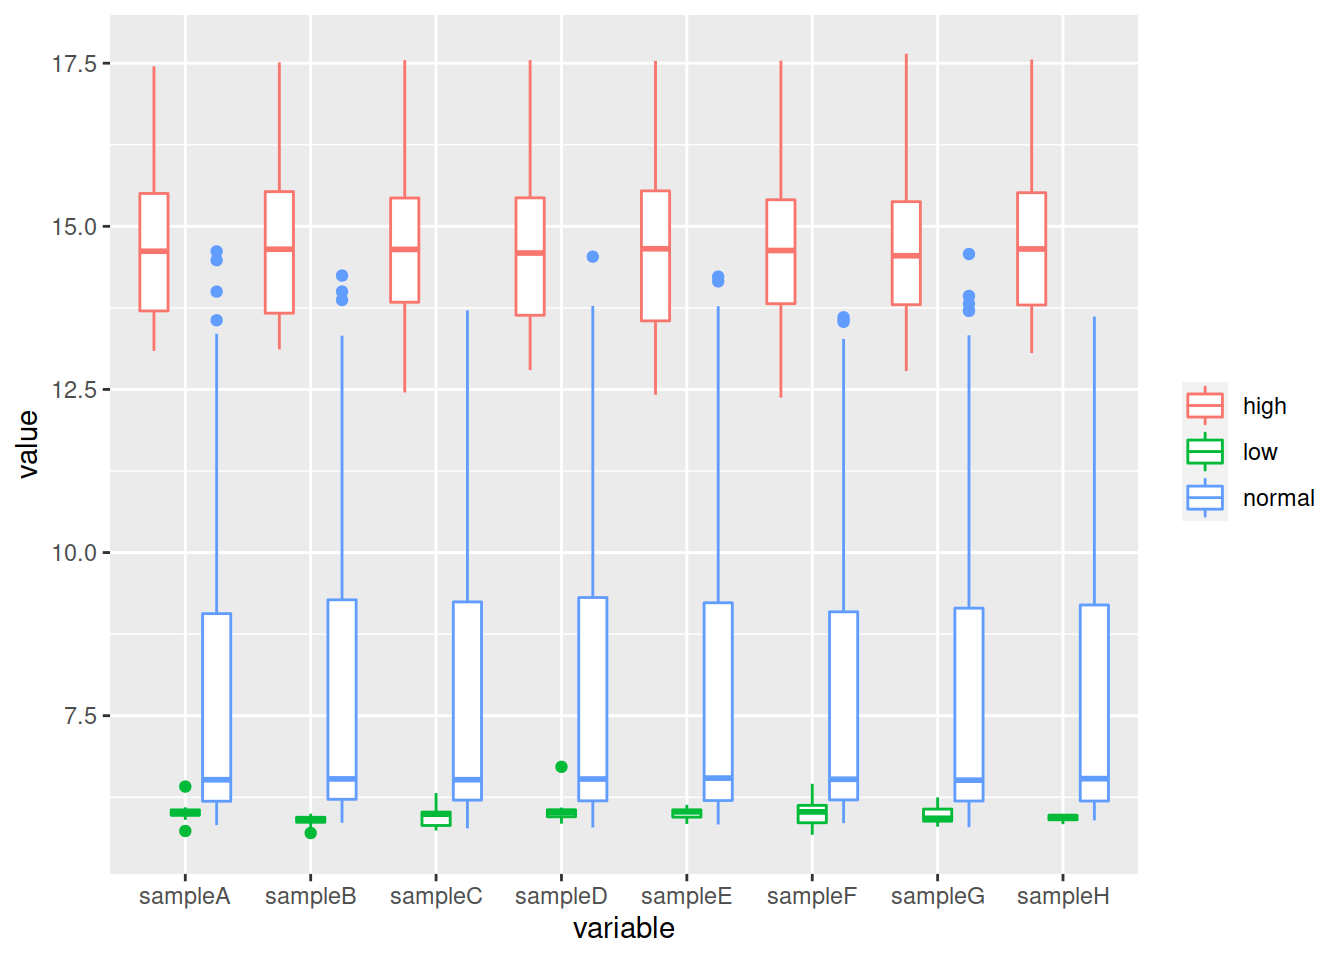
# Change font of legend text
boxp + theme(legend.title=element_blank(),
  legend.text = element_text(colour="red", size = 8, face = "bold"))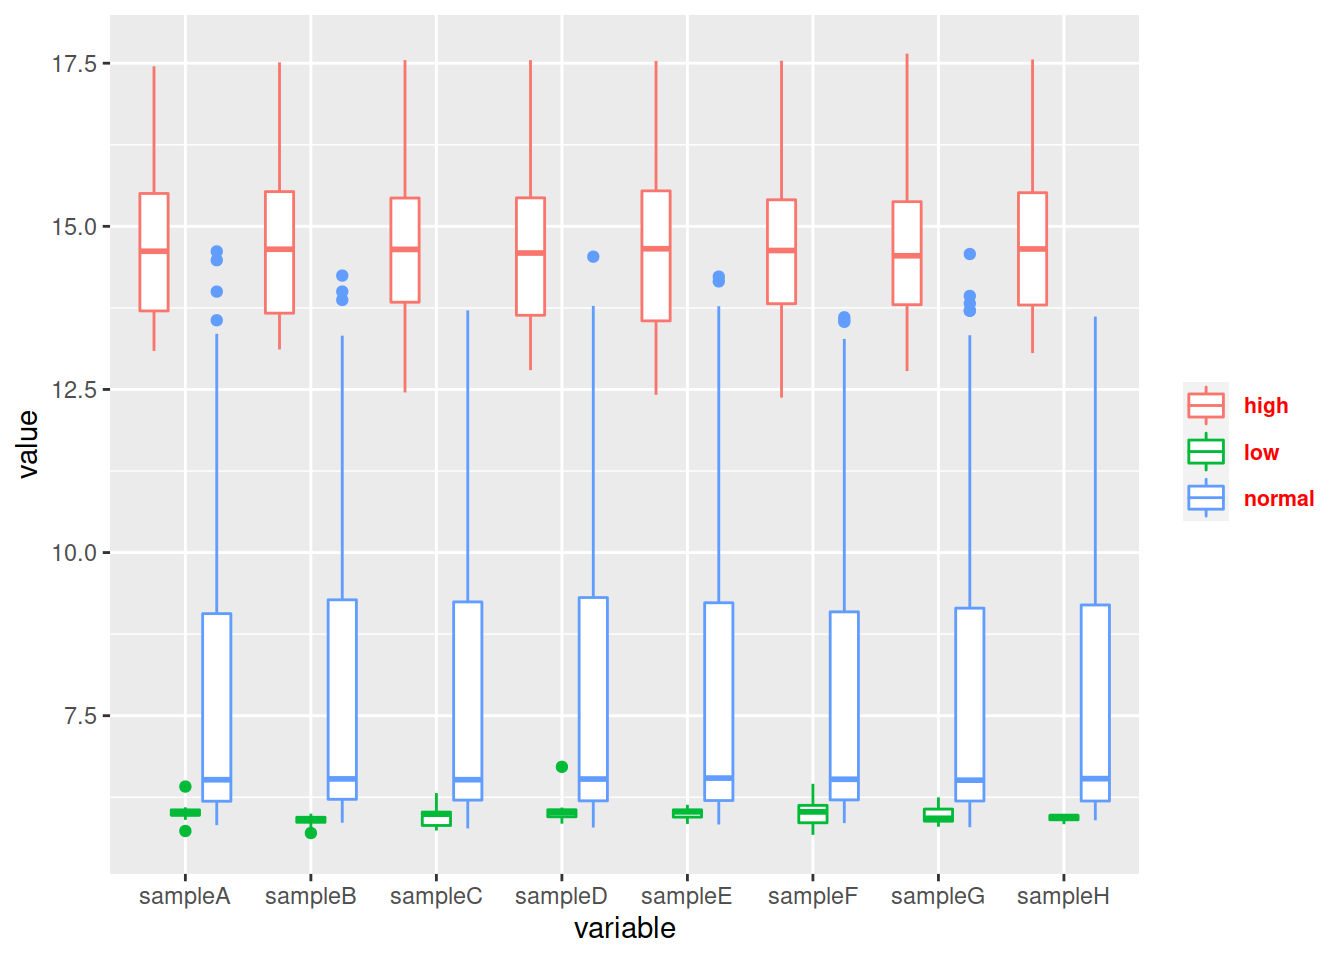
# Put legend on the top of the plot
boxp + theme(legend.title=element_blank(),
  legend.text = element_text(colour="red", size = 8, face = "bold"),
  legend.position="top")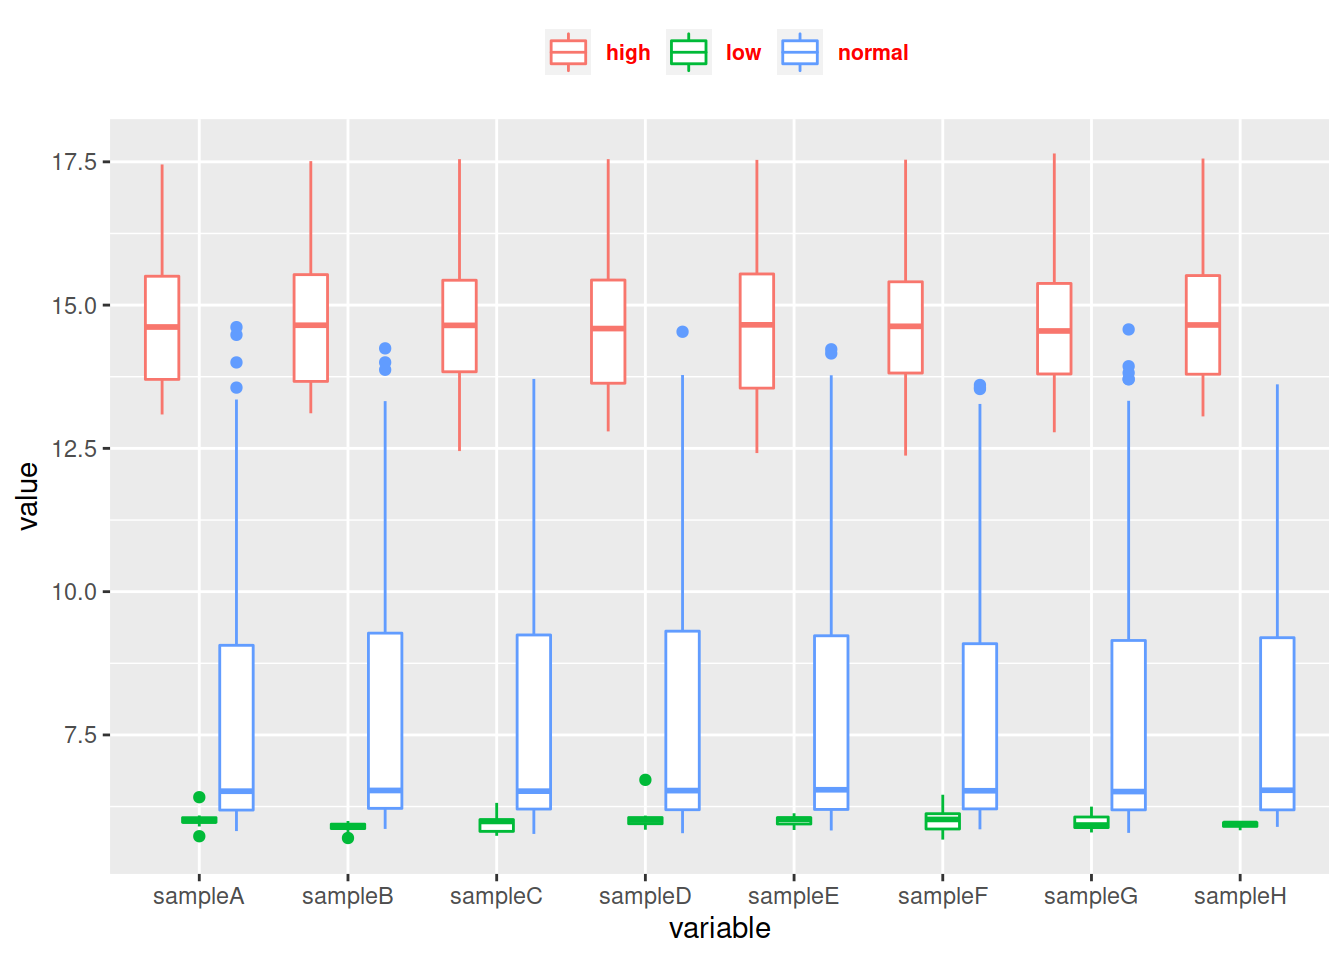
# Rotate x-axis labels
boxp + theme(legend.title=element_blank(),
  legend.text = element_text(colour="red", size = 8, face = "bold"),
  legend.position="top",
  axis.text.x = element_text(angle = 90))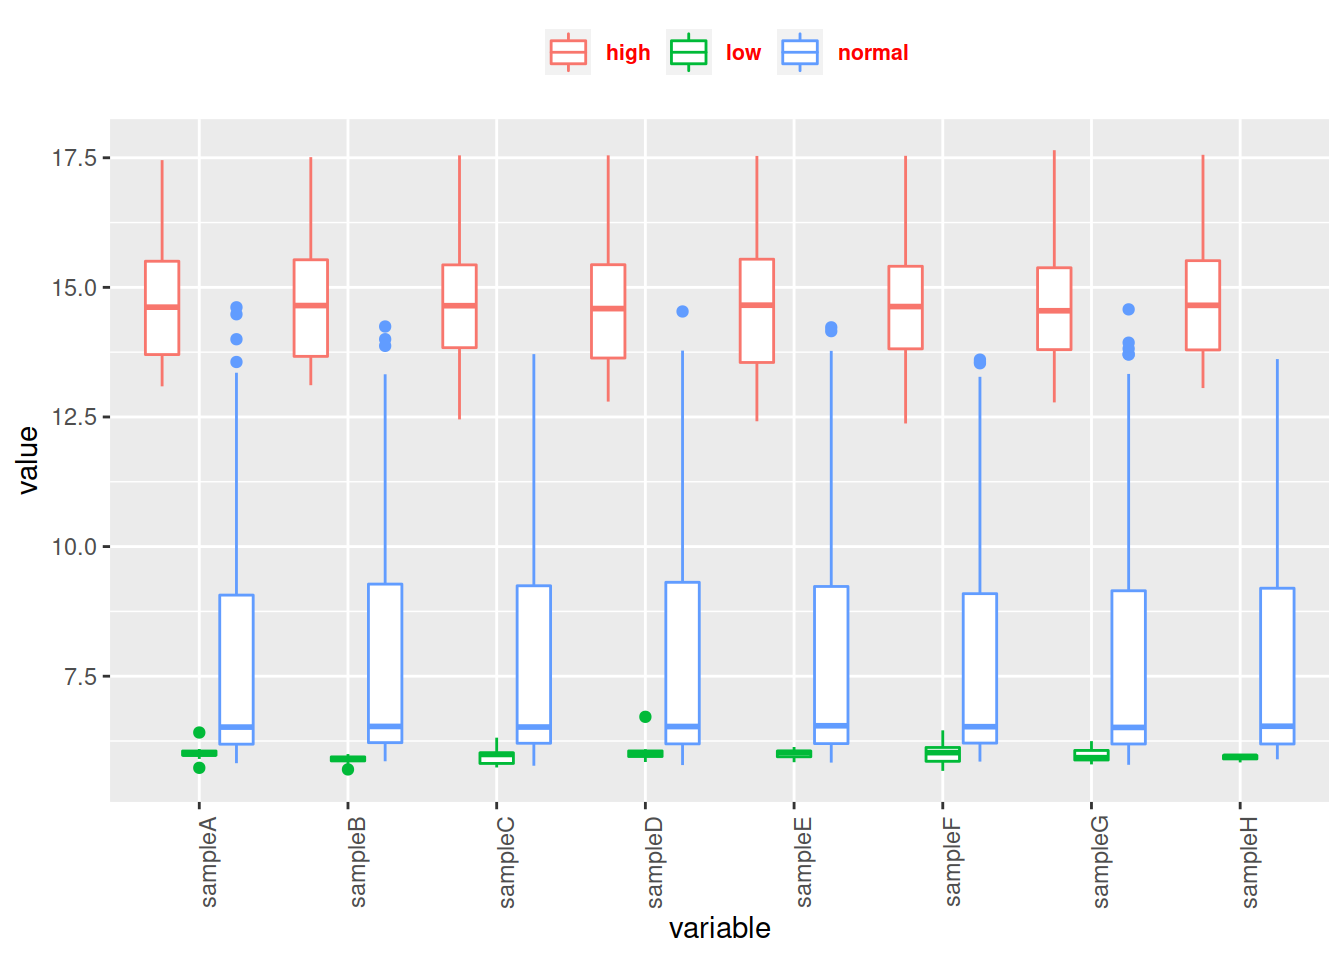
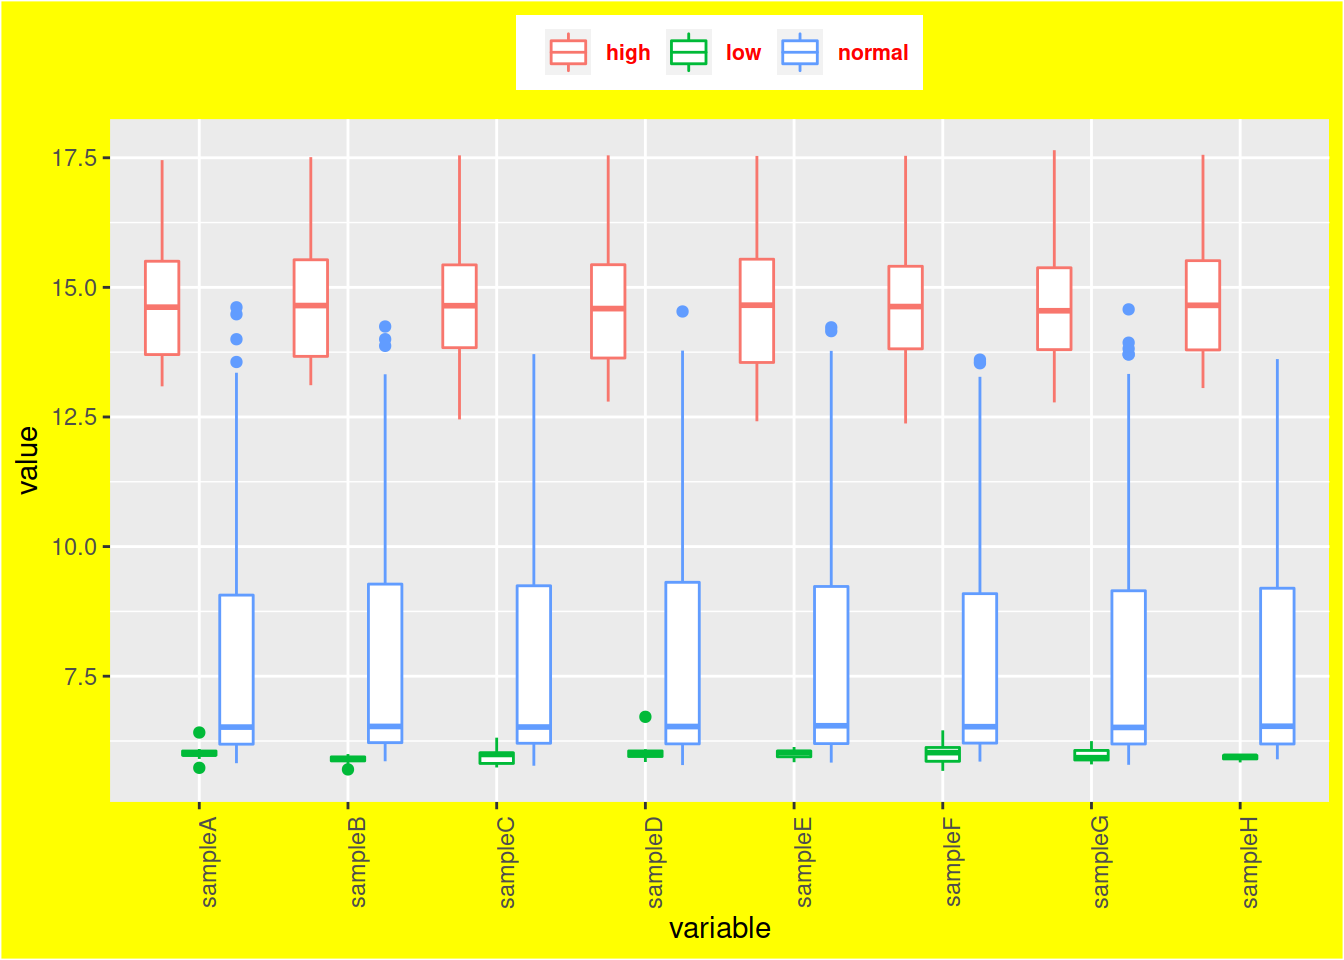
# Add a color to the plot's background
boxp + theme(legend.title=element_blank(),
  legend.text = element_text(colour="red", size = 8, face = "bold"),
  legend.position="top",
  axis.text.x = element_text(angle = 90),
  plot.background = element_rect(fill = "yellow"))