14.2 With the console
# Open the file that will contain your plot (the name is up to you)
pdf(file="myplot.pdf")

# execute the plot
plot(1:10)

# Close and save the file that will contain the plot
dev.off()
Formats
R supports a variety of file formats for figures: pdf, png, jpeg, tiff, bmp, svg, ps.
They all come with their own function, for example:
# TIFF
tiff(file="myfile.tiff")

    plot(1:10)

dev.off()

# JPEG
jpeg(file="myfile.jpeg")

    plot(1:10)

dev.off()

# etc.
The size of the output file can be changed:
# Default: 7 inches (both width and height) for svg, pdf, ps.
svg(file="myfile.svg", width=8, height=12)

    plot(1:10)

dev.off()

# Default: 480 pixels (both width and height) for jpeg, tiff, png, bmp.
png(file="myfile.png", width=500, height=600)

    plot(1:10)

dev.off()
Note that pdf is the only format that supports saving several pages:
pdf(file="myfile_pages.pdf")

    plot(1:10)
    plot(2:20)

dev.off()- If your file is empty: run
dev.off()once or more to make sure there is no devices/files still open!.
Plot several figures in one page
You can output more than one plot per page using the par() function (par() sets graphical parameters) and the mfrow argument.
jpeg(file="myfile_multi.jpeg")

# organize the plot in 1 row and 2 columns:
    # nr: number of rows
    # nc: number of columns
par(mfrow=c(nr=1, nc=2))

    plot(1:10)
    plot(2:20)

dev.off()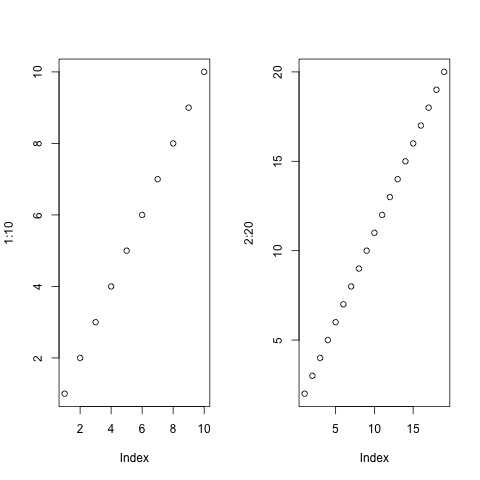
jpeg(file="myfile_multi4.jpeg")

# organize the plot in 2 rows and 2 columns
par(mfrow=c(nr=2, nc=2))

# top-left
plot(1:10)
# top-right
barplot(table(rep(c("A","B"), c(2,3))))
# bottom-left
pie(table(rep(c("A","B"), c(2,3))))
# bottom-right
hist(rnorm(2000))

dev.off()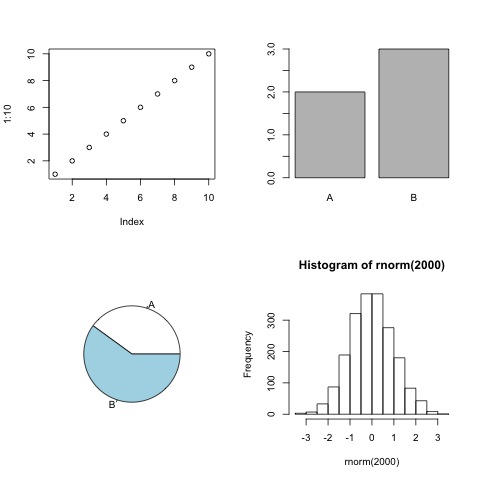
HANDS-ON
Go back to the previous plots you created (if you didn’t save commands in an R script, you can refer to the History tab in the top-right panel):
- Save 1 plot of your choice in a jpeg file.
- Save 3 plots of your choice in a pdf file (one plot per page).
- Organize the same 3 plots in 1 row / 3 columns. Save the image in a png file. Play with the width (and perhaps also height) argument of
png()until you are satisfied with the way the plot renders.
Answer
# Save 1 plot of your choice in a **jpeg** file.
jpeg("myboxplot.jpeg")
boxplot(chickwts$weight ~ chickwts$feed, las=2)
dev.off()

# Save 3 plots of your choice in a **pdf** file (one plot per page).
pdf("my3plots.pdf")
boxplot(chickwts$weight ~ chickwts$feed, las=2)
barplot(table(chickwts$feed))
plot(x=Loblolly$age, y=Loblolly$height,
     main="Age and weight of Loblolly pine trees",
     pch=17,
     col="red",
     cex=0.4)
dev.off()

# Organize the same 3 plots in 1 row / 3 columns. Save the image in a **png** file.
png("my3plots.png", width=1000, height=350)
par(mfrow=c(1, 3))
boxplot(chickwts$weight ~ chickwts$feed, las=2)
barplot(table(chickwts$feed))
plot(x=Loblolly$age, y=Loblolly$height,
     main="Age and weight of Loblolly pine trees",
     pch=17,
     col="red",
     cex=0.4)
dev.off()