13.3 Pie charts
A pie chart is a circular charts which is divided into slices, illustrating proportions.
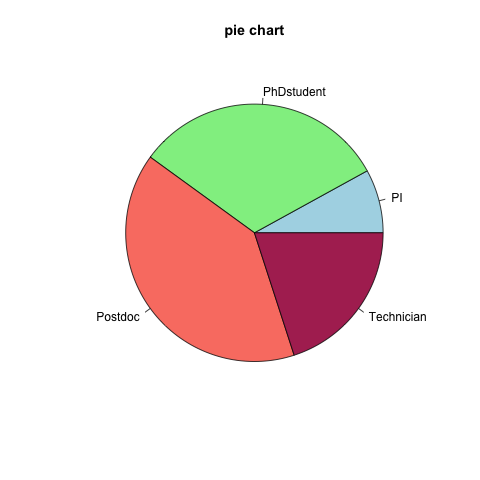
- Using our previous vector, build a simple pie chart:
# Create a vector
mycenter <- rep(x=c("PhDstudent", "Postdoc", "Technician", "PI"),
         times=c(8,10,5,2))

# Count number of occurences of each string
mytable <- table(mycenter)

pie(mytable,
    main="pie chart",
    col=c("lightblue", "lightgreen", "salmon", "maroon"))